澳洲NEM電力市場負電價頻率與極端天氣衝擊:2024–2026年季度數據解析
澳洲國家電力市場(NEM)正在經歷一場前所未有的結構性轉型。根據澳洲能源市場運營商(AEMO)發布的季度能源動態(QED)報告,從2024年第一季至2026年第一季的九個季度數據顯示,負電價頻率呈現加速上升趨勢,並在2025年第四季創下31.0%的歷史紀錄。與此同時,極端天氣事件持續推高峰值電價,形成「低谷負電價」與「峰時超高電價」並存的雙極化市場結構。
## 一、NEM整體負電價頻率趨勢
負電價是指市場結算價格低於零的調度區間,通常發生在可再生能源(尤其是太陽能)大量輸出而需求相對低迷的時段。下表匯總了2024年第一季至2026年第一季的NEM全網負電價頻率:
| 季度 | NEM整體負電價頻率 | 備注 |
|------|-----------------|------|
| 2024 Q1 | 12.3% | 同比首次下降(前年12.5%) |
| 2024 Q2 | 7.0% | 同比下降2個百分點 |
| 2024 Q3 | 19.5% | 同比微升 |
| 2024 Q4 | 23.1% | 當時歷史紀錄 |
| 2025 Q1 | 18.0% | 同比上升5.6個百分點 |
| 2025 Q2 | 10.6% | 第二季歷史新高 |
| 2025 Q3 | 18.9% | 環比微降 |
| **2025 Q4** | **31.0%** | **歷史最高紀錄** |
| 2026 Q1 | 14.9% | 同比下降3個百分點 |
*數據來源:AEMO QED Q1 2024 至 Q1 2026*
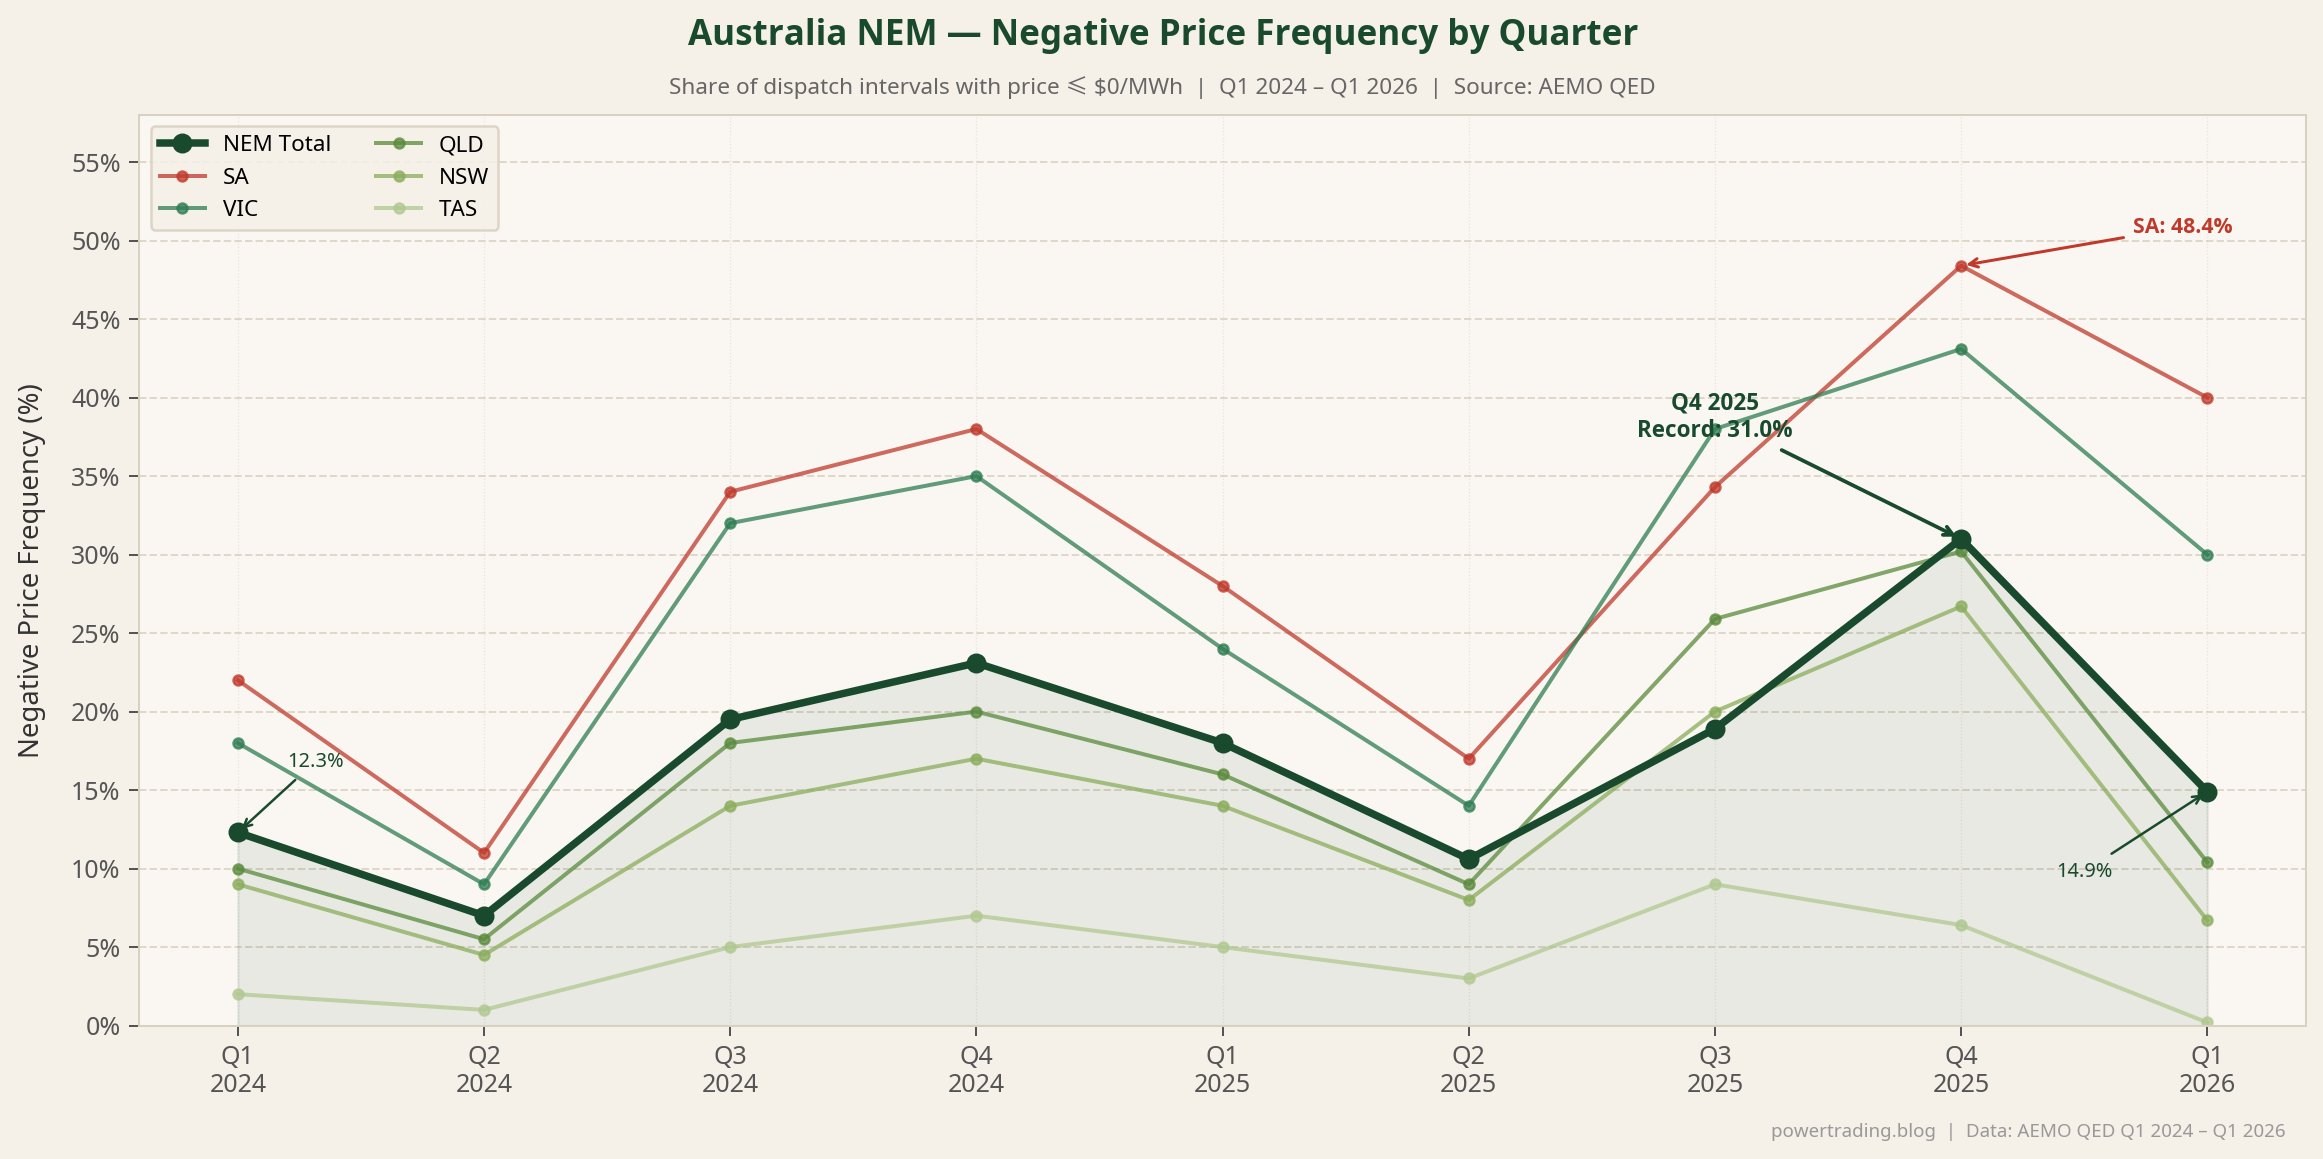
*圖:NEM各地區及全網負電價頻率季度走勢(2024年第一季至2026年第一季)。NEM全網(深綠粗線)在2025年第四季達到31.0%歷史峰值,南澳(紅線)同期高達48.4%。虛線為NEM全網均值(31.0%)。資料來源:AEMO QED。*
值得注意的是,2024年第一季曾出現同比首次下降,但這一趨勢並未持續。從2024年第三季起,負電價頻率重新加速,並在2025年第四季(澳洲夏季)達到31.0%的峰值,意味著全年近三分之一的調度區間電價為負。
## 二、分地區負電價頻率解析
NEM由昆士蘭(QLD)、新南威爾士(NSW)、維多利亞(VIC)、南澳(SA)及塔斯馬尼亞(TAS)五個地區組成,各地區因資源結構差異,負電價頻率呈現顯著分化。
**2025年第四季(歷史峰值季度)分地區數據:**
| 地區 | 負電價頻率 |
|------|-----------|
| 南澳(SA) | **48.4%** |
| 維多利亞(VIC) | 43.1% |
| 昆士蘭(QLD) | 30.2% |
| 新南威爾士(NSW) | 26.7% |
| 塔斯馬尼亞(TAS) | 6.4% |
| **NEM全網** | **31.0%** |
南澳以48.4%高居榜首,反映其高比例可再生能源滲透率(尤其是屋頂太陽能)與有限的州際互聯容量之間的結構性矛盾。塔斯馬尼亞則因水力發電的靈活調節能力,負電價頻率僅6.4%,是NEM中最低的地區。
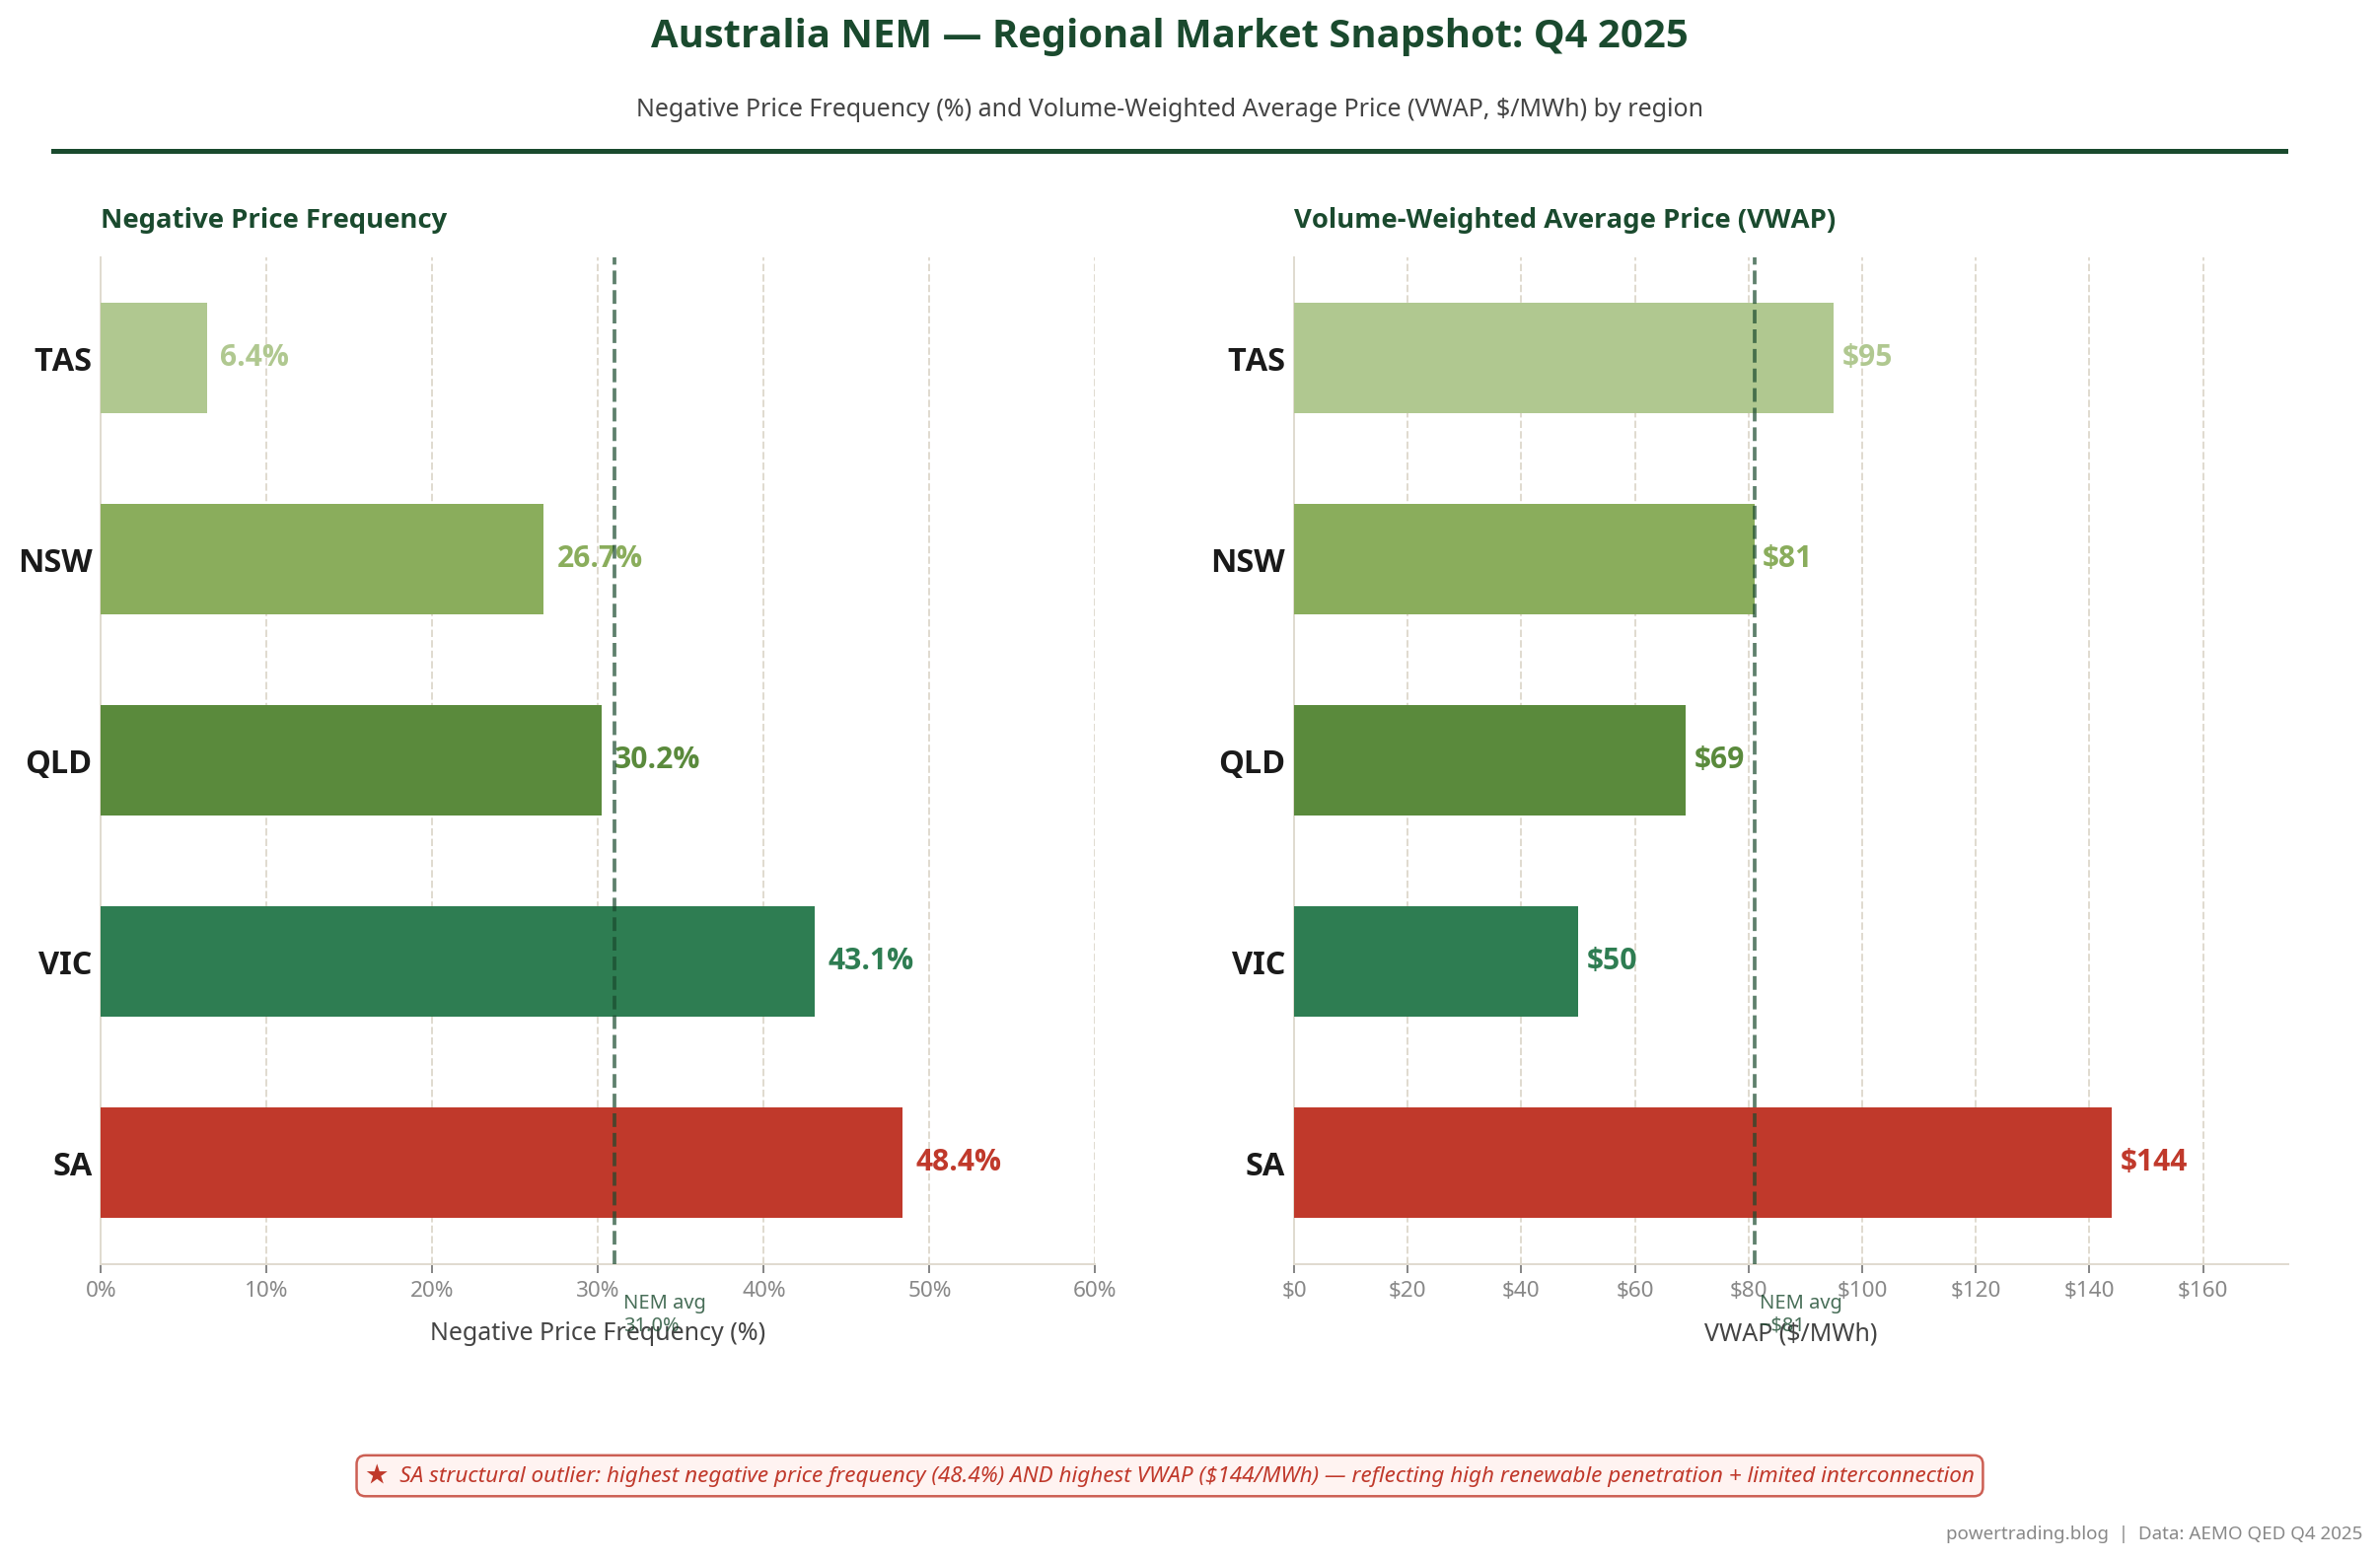
*圖:2025年第四季NEM五個地區負電價頻率(左)與量加權均價VWAP(右)對比。南澳(SA)同時呈現最高負電價頻率(48.4%)與最高VWAP($144/MWh),是NEM中最具雙極化特徵的地區。資料來源:AEMO QED Q4 2025。*
在日間時段(09:00–17:00),負電價現象更為集中。2024年第三季,昆士蘭日間負電價頻率高達66%(同比上升13個百分點),新南威爾士達38%(同比上升5個百分點)。至2026年第一季,南澳日間負電價頻率更達67%,顯示太陽能滲透已使日間電力市場進入「常態性負電價」狀態。
## 三、地區現貨均價與電價分化
負電價頻率的上升並不意味著整體電價下降——事實上,各地區均價呈現明顯分化,南澳的結構性溢價尤為突出。
**2026年第一季地區平均現貨電價:**
| 地區 | 均價($/MWh) | 同比變化 |
|------|-------------|---------|
| 維多利亞(VIC) | $43 | -28%(最低) |
| 昆士蘭(QLD) | $65 | -27% |
| 新南威爾士(NSW) | $73 | -16% |
| 南澳(SA) | $88 | 同比上升 |
| 塔斯馬尼亞(TAS) | $94 | -15%(最高) |
**2025年第四季量加權均價(VWAP):**
| 地區 | VWAP($/MWh) |
|------|-------------|
| 維多利亞(VIC) | $50(最低) |
| 昆士蘭(QLD) | $69 |
| 新南威爾士(NSW) | $81 |
| 塔斯馬尼亞(TAS) | $95 |
| 南澳(SA) | **$144**(最高) |
南澳在2025年第四季的VWAP高達$144/MWh,是同期維多利亞($50/MWh)的近三倍。這一極端溢價反映了南澳高度依賴天然氣調峰、州際互聯容量有限,以及極端天氣事件頻發等多重結構性因素。
## 四、高電價事件與上限容量回報
儘管負電價頻率創歷史新高,高電價事件(超過$300/MWh市場上限)的發生頻率與強度同樣不容忽視。NEM全網上限容量回報(Cap Return)從2025年第一季的$36/MWh上升至2026年第一季的$51/MWh,同比增加$15/MWh,顯示高電價波動事件的對沖價值顯著提升。
南澳在2026年第一季貢獻了$38/MWh的上限回報,是NEM五個地區中最高的,進一步印證了南澳市場的雙極化特徵:既有最高的負電價頻率,也有最高的峰值電價風險。
## 五、極端天氣事件案例分析
極端天氣事件是推動NEM峰值電價飆升的主要催化劑。以下為2024年至2026年第一季的重要案例:
**2026年1月 新南威爾士熱浪**
2026年1月10日,悉尼氣溫突破40°C。當日傍晚(18:35–19:20),新南威爾士電價在9個調度區間內超過$10,000/MWh,反映了空調負荷激增與供應緊張的疊加效應。
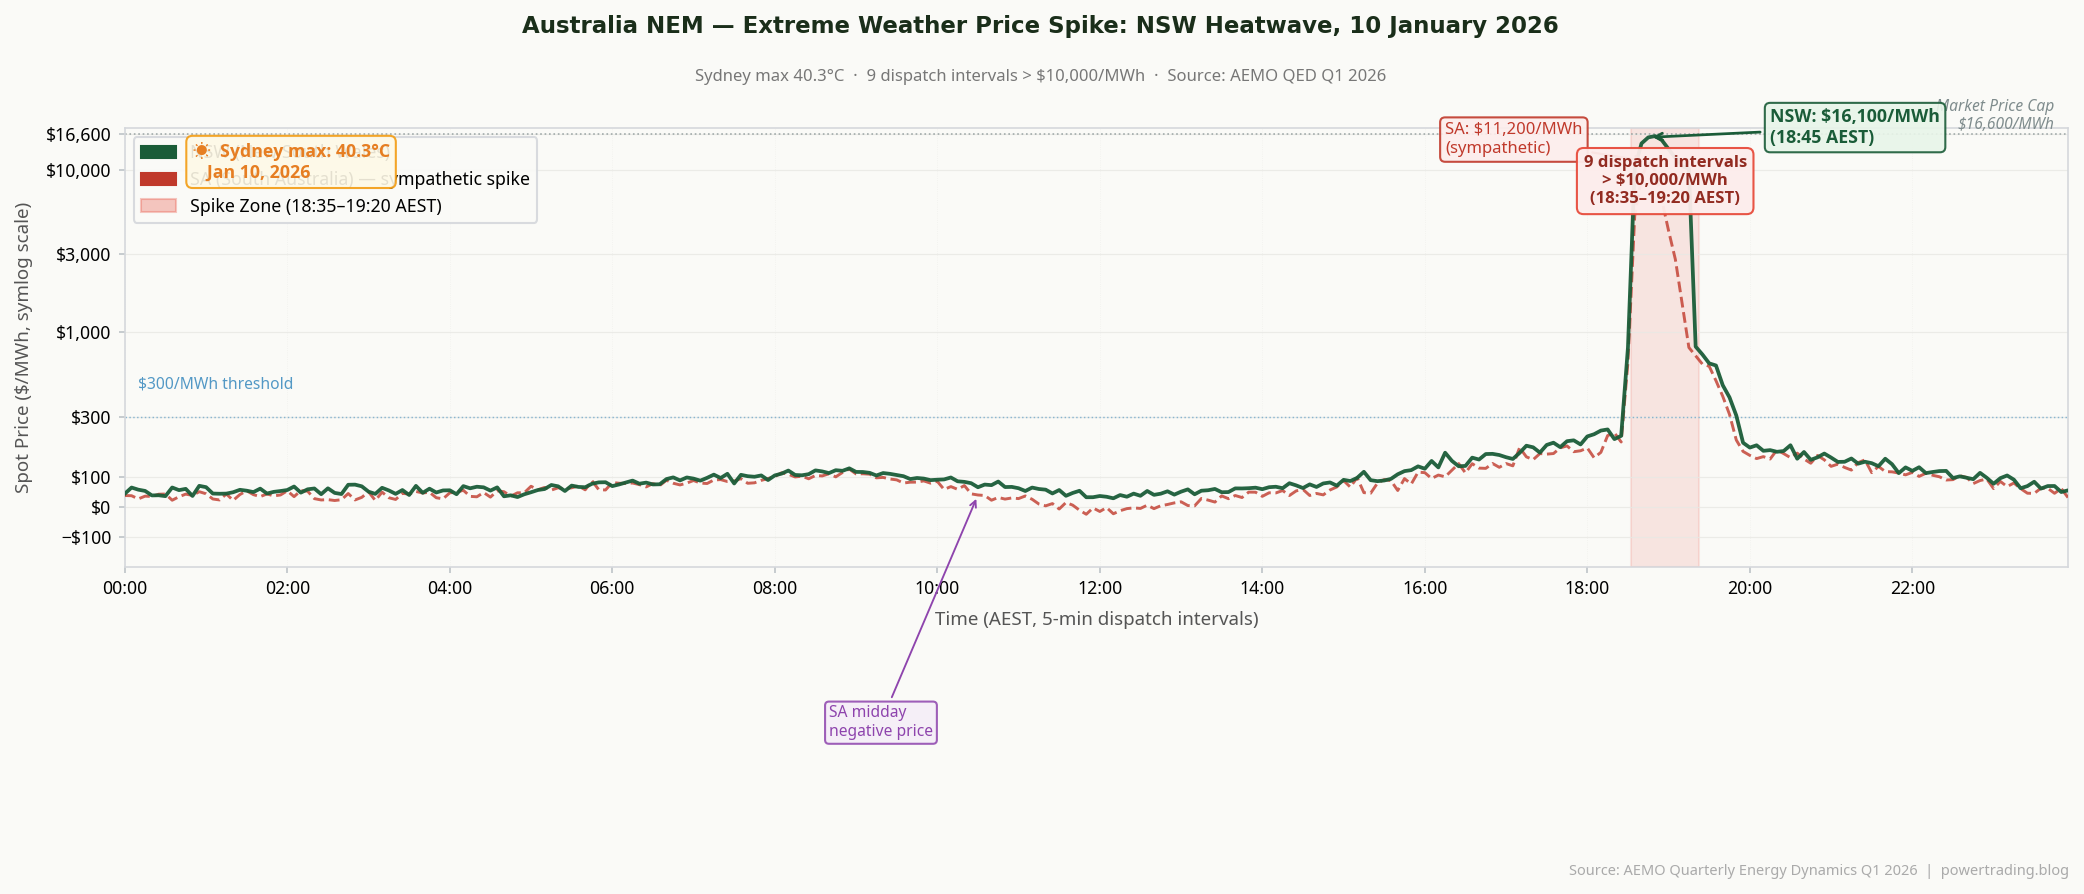
*圖:2026年1月10日新南威爾士(NSW)與南澳(SA)全日5分鐘調度區間電價走勢(對數刻度)。悉尼當日最高氣溫40.3°C,傍晚18:35–19:20共9個調度區間電價超過$10,000/MWh,峰值達$16,100/MWh(接近市場上限$16,600/MWh)。南澳同步出現同情性飆升,最高達$11,200/MWh。日間南澳負電價亦清晰可見。資料來源:AEMO QED Q1 2026。*
**2026年1月 南澳熱浪**
同月下旬,南澳遭遇更為嚴峻的熱浪衝擊。在傍晚高峰時段(19:30–20:10),電價在6個調度區間內超過$17,000/MWh,接近市場價格上限($16,600/MWh)。此外,凌晨至早晨時段(04:05–08:20)亦出現劇烈波動,顯示供應側壓力持續至次日清晨。
**2024年11月 新南威爾士熱浪**
2024年11月,悉尼氣溫達39°C,導致需求較前三年同期11月峰值高出約2,000 MW。同期有4台燃煤機組和1台大型燃氣機組停機,輸電系統亦出現故障,形成供需雙向緊張局面。
**2024年10月 南澳輸電事故**
2024年10月19日,極端天氣損毀多座輸電鐵塔,導致南澳網絡停電,包括Olympic Dam在內的大型工業負荷失去供電,引發電價劇烈波動。
**2025年第一季 熱帶氣旋Alfred**
2025年2月下旬至3月初,熱帶氣旋Alfred登陸澳洲東海岸,短暫中斷東海岸天然氣市場供應,並導致LNG生產下降,對昆士蘭及新南威爾士電力市場造成衝擊。
**2025年8月 珀斯寒潮**
2025年8月25日,珀斯錄得有記錄以來最冷的冬日,需求激增疊加供應約束,導致西澳電力市場出現極端高電價。
## 六、結構性趨勢分析
綜合九個季度的數據,可以識別出以下六項關鍵結構性趨勢:
**1. 太陽能滲透驅動日間負電價常態化**
屋頂太陽能與大型地面電站的持續擴張,使日間(09:00–17:00)負電價成為常態。南澳日間負電價頻率已達67%(2026年第一季),昆士蘭達66%(2024年第三季),顯示傳統「日間高電價、夜間低電價」的市場結構已根本性逆轉。
**2. 負電價頻率加速上升**
2024年第四季的23.1%曾是歷史紀錄,但僅一年後的2025年第四季便被31.0%打破。這一加速趨勢表明,可再生能源裝機增速已超越市場消納能力的提升速度。
**3. BESS定價影響力顯著提升**
在2026年第一季的昆士蘭市場,電池儲能系統(BESS)在超過40%的調度區間中成為邊際定價主體,反映BESS已從「套利者」演變為市場結構的核心參與者。
**4. 南澳結構性溢價持續**
南澳同時呈現最高的負電價頻率(48.4%)和最高的峰值電價(VWAP $144/MWh),形成獨特的「雙極化」市場結構。這一結構源於高可再生能源滲透率、有限的互聯容量以及天然氣調峰依賴的組合。
**5. 塔斯馬尼亞水電作為系統緩衝**
塔斯馬尼亞持續保持NEM最低的負電價頻率(0.2%–9%),水力發電的靈活調節能力通過Basslink互聯線路對整個NEM系統起到穩定作用。
**6. 上限容量回報上升,對沖價值增加**
NEM全網上限容量回報從$36/MWh(2025年第一季)升至$51/MWh(2026年第一季),表明儘管平均電價因可再生能源增加而下降,高電價波動事件的頻率與強度並未減弱,對沖工具(如上限合約)的價值持續提升。
## 七、市場參與者的策略啟示
上述趨勢對NEM市場參與者具有重要的策略含義。
對於**電池儲能系統(BESS)運營商**而言,日間負電價的常態化提供了低成本充電窗口,而峰時超高電價(尤其是熱浪期間)則創造了高價值放電機會。南澳市場的雙極化特徵使其成為BESS套利的理想場所,但同時也意味著更高的市場風險。
對於**電力零售商與大型用電方**而言,上限容量回報的上升意味著高電價對沖成本增加。在極端天氣事件頻發的背景下,合理配置上限合約(Cap Contracts)成為風險管理的必要手段。
對於**可再生能源開發商**而言,日間負電價的常態化直接壓縮了無儲能配套的太陽能項目的收益空間,推動儲能配套成為新項目的標準配置。
## 結語
澳洲NEM正在進入一個由可再生能源主導、但同時面臨極端天氣衝擊的新市場時代。負電價頻率的持續上升與峰值電價的間歇性飆升,共同構成了市場的「雙極化」特徵。理解這一結構性轉變,對於在NEM市場中進行投資、交易與風險管理的各類參與者而言,具有不可忽視的戰略意義。
**數據來源:** AEMO季度能源動態(QED)報告,2024年第一季至2026年第一季。オーストラリアNEM電力市場の価格変動と極端気象の影響:2024〜2026年四半期データ分析
オーストラリア国家電力市場(NEM)は、歴史的な規模の構造的変革を経験している。オーストラリアエネルギー市場運営者(AEMO)が発行する四半期エネルギー動態(QED)レポートの2024年第1四半期から2026年第1四半期までの9四半期分のデータは、ネガティブ価格頻度の加速的な上昇傾向を示しており、2025年第4四半期には過去最高の31.0%を記録した。同時に、極端気象事象が周期的な価格急騰を引き続き引き起こし、日中の持続的なネガティブ価格とピーク需要時の極端な高価格が共存する二極化した市場構造が形成されている。
## 1. NEM全体のネガティブ価格頻度の推移
ネガティブ価格とは、市場清算価格がゼロを下回るディスパッチ区間のことであり、通常は再生可能エネルギー(特に太陽光発電)の大量出力と相対的に低い需要が重なる時間帯に発生する。以下の表は、対象期間9四半期のNEM全体のネガティブ価格頻度をまとめたものである。
| 四半期 | NEM全体頻度 | 備考 |
|--------|-----------|------|
| 2024年Q1 | 12.3% | 前年比初の低下(前年12.5%) |
| 2024年Q2 | 7.0% | 前年比2ポイント低下 |
| 2024年Q3 | 19.5% | 前年比微増 |
| 2024年Q4 | 23.1% | 当時の過去最高 |
| 2025年Q1 | 18.0% | 前年比5.6ポイント上昇 |
| 2025年Q2 | 10.6% | Q2過去最高 |
| 2025年Q3 | 18.9% | 前四半期比微減 |
| **2025年Q4** | **31.0%** | **過去最高記録** |
| 2026年Q1 | 14.9% | 前年比3.0ポイント低下 |
*出典:AEMO QED 2024年Q1〜2026年Q1*

*図:NEM各地域およびNEM全体のネガティブ価格頻度の四半期別推移(2024年Q1〜2026年Q1)。NEM全体(濃緑の太線)は2025年Q4に31.0%の過去最高を記録し、南オーストラリア(赤線)は同四半期に48.4%に達した。破線はNEM平均(31.0%)を示す。出典:AEMO QED。*
2024年第1四半期の前年比低下は一時的な現象に過ぎず、2024年第3四半期以降は上昇基調が再加速した。2025年第4四半期(オーストラリアの夏季)には、NEM全体でほぼ3回に1回のディスパッチ区間がネガティブ価格で清算されるという状況に達した。
## 2. 地域別ネガティブ価格頻度の分析
NEMはクイーンズランド(QLD)、ニューサウスウェールズ(NSW)、ビクトリア(VIC)、南オーストラリア(SA)、タスマニア(TAS)の5地域で構成されており、発電ミックスと系統連系容量の構造的差異により、地域間でネガティブ価格頻度に顕著な差異が生じている。
**2025年第4四半期(過去最高記録の四半期)地域別データ:**
| 地域 | ネガティブ価格頻度 |
|------|-----------------|
| 南オーストラリア(SA) | **48.4%** |
| ビクトリア(VIC) | 43.1% |
| クイーンズランド(QLD) | 30.2% |
| ニューサウスウェールズ(NSW) | 26.7% |
| タスマニア(TAS) | 6.4% |
| **NEM合計** | **31.0%** |
南オーストラリアの48.4%という頻度は、特に屋根置き太陽光発電の高い普及率と限られた州際連系容量との構造的な矛盾を反映している。一方、タスマニアは柔軟な水力発電の調整能力により、ネガティブ価格頻度はわずか6.4%にとどまっており、NEM全体で最も低い水準にある。

*図:2025年Q4のNEM5地域のネガティブ価格頻度(左)とVWAP(右)の比較。南オーストラリア(SA)は最高のネガティブ価格頻度(48.4%)と最高のVWAP($144/MWh)を同時に記録しており、市場の二極化構造を示している。出典:AEMO QED Q4 2025。*
日中時間帯(09:00〜17:00)では、ネガティブ価格の集中がさらに顕著である。2024年第3四半期には、クイーンズランドの日中ネガティブ価格頻度が66%(前年比13ポイント上昇)、ニューサウスウェールズが38%(前年比5ポイント上昇)に達した。2026年第1四半期には、南オーストラリアの日中頻度が67%に達しており、太陽光発電の高普及地域における日中電力市場が構造的なネガティブ価格の状態に入っていることを示している。
## 3. 地域別平均現物価格と価格乖離
ネガティブ価格頻度の上昇が均一に平均価格の低下をもたらすわけではない。地域別の平均現物価格には大きな乖離があり、南オーストラリアの構造的プレミアムがNEMの特徴的な要素として際立っている。
**2026年第1四半期 地域別平均現物価格:**
| 地域 | 平均価格($/MWh) | 前年比 |
|------|----------------|-------|
| ビクトリア(VIC) | $43 | -28%(最低) |
| クイーンズランド(QLD) | $65 | -27% |
| ニューサウスウェールズ(NSW) | $73 | -16% |
| 南オーストラリア(SA) | $88 | 前年比上昇 |
| タスマニア(TAS) | $94 | -15%(最高) |
**2025年第4四半期 出来高加重平均価格(VWAP):**
| 地域 | VWAP($/MWh) |
|------|-------------|
| ビクトリア(VIC) | $50(最低) |
| クイーンズランド(QLD) | $69 |
| ニューサウスウェールズ(NSW) | $81 |
| タスマニア(TAS) | $95 |
| 南オーストラリア(SA) | **$144**(最高) |
南オーストラリアの2025年第4四半期VWAPは$144/MWhと、同期のビクトリア($50/MWh)の約3倍に達した。これはガス依存のピーク発電容量、限られた系統連系容量、および頻繁な極端気象事象の組み合わせを反映している。
## 4. 高価格事象とキャップ・リターン
過去最高のネガティブ価格頻度にもかかわらず、高価格事象(市場価格上限に近づく区間)の強度は衰えていない。NEM全体のキャップ・リターン($300/MWhキャップ契約の価値)は、2025年第1四半期の$36/MWhから2026年第1四半期には$51/MWhへと$15/MWh上昇しており、高価格保護のヘッジ価値が大幅に増加していることを示している。
南オーストラリアは2026年第1四半期に$38/MWhのキャップ・リターンを記録し、NEM5地域の中で最高となった。これは、SA市場の二極化した性質をさらに示すものであり、NEM全体で最高のネガティブ価格頻度と最高のピーク価格リスクを同時に示している。
## 5. 極端気象事象のケーススタディ
極端気象事象はNEMの価格急騰の主要な触媒として機能している。以下は2024年から2026年第1四半期にかけての重要な事例である。
**2026年1月 ニューサウスウェールズ熱波**
2026年1月10日、シドニーの気温が40°Cを超えた。夕方のピーク時間帯(18:35〜19:20)には、ニューサウスウェールズの現物価格が9つの連続するディスパッチ区間で$10,000/MWhを超え、エアコン負荷の急増と供給制約の重なりを反映した。

*図:2026年1月10日のNSWおよびSAの5分間ディスパッチ区間電価の日内推移(対数スケール)。シドニーの最高気温が40.3°Cに達した同日、18:35〜19:20 AESTの9区間で電価が$10,000/MWhを超え、ピーク時には$16,100/MWh(市場価格上限$16,600/MWhに迫る水準)を記録した。SAも同情的急騰で最高$11,200/MWhに達した。SA日中のネガティブ価格も確認できる。出典:AEMO QED Q1 2026。*
**2026年1月 南オーストラリア熱波**
2026年1月下旬、南オーストラリアはさらに深刻な熱波に見舞われた。夕方のピーク時間帯(19:30〜20:10)には、SA価格が6つのディスパッチ区間で$17,000/MWhを超え、市場価格上限($16,600/MWh)に近づいた。早朝から午前にかけての時間帯(04:05〜08:20)にも大きな価格変動が続き、供給側の圧力が翌朝まで続いたことを示している。
**2024年11月 ニューサウスウェールズ熱波**
2024年11月、シドニーの気温が39°Cに達し、需要が過去3年間の11月ピーク需要を約2,000 MW上回った。同時に4基の石炭ユニットと1基の大型ガスユニットが停止しており、送電系統の制約も加わって供給需要の両面で逼迫した状況が生じた。
**2024年10月 南オーストラリア送電事故**
2024年10月19日、極端気象が複数の送電鉄塔を損傷し、南オーストラリアで系統停電が発生した。Olympic Damを含む大型産業負荷が電力供給を失い、SA地域全体で大きな価格変動が引き起こされた。
**2025年第1四半期 熱帯低気圧アルフレッド**
2025年2月下旬から3月初旬にかけて、熱帯低気圧アルフレッドがオーストラリア東海岸に上陸し、東海岸のガス市場を混乱させ、LNG生産の低下を引き起こした。この事象はクイーンズランドおよびニューサウスウェールズの電力市場に一時的な影響を与えた。
**2025年8月 パース寒波**
2025年8月25日、パースは記録上最も寒い冬の日を記録した。暖房需要の急増と供給制約の組み合わせにより、西オーストラリアの電力市場で極端な高価格事象が発生した。
## 6. 構造的トレンドの分析
9四半期のデータから、NEMを再形成する6つの主要な構造的トレンドが識別できる。
**トレンド1:太陽光発電の普及による日中ネガティブ価格の常態化**
屋根置きおよびユーティリティスケールの太陽光発電の継続的な拡大により、日中のネガティブ価格が構造的な特徴となっている。SAの日中頻度67%、QLD 66%という数値は、高太陽光地域における従来の「日中高価格」という市場パターンが根本的に逆転したことを示している。
**トレンド2:ネガティブ価格頻度の加速的上昇**
2024年第4四半期の23.1%は当時の記録とされたが、わずか1年後の2025年第4四半期には31.0%によって塗り替えられた。この加速は、再生可能エネルギーの設備増加ペースが需要応答、蓄電池、または系統連系による余剰電力吸収能力の向上を上回っていることを示している。
**トレンド3:BESSが価格決定力を持つ存在へと台頭**
2026年第1四半期のクイーンズランドでは、電池エネルギー貯蔵システム(BESS)が40%を超えるディスパッチ区間で限界価格を設定しており、BESSが価格受容者としての裁定取引者から構造的な価格設定者へと移行したことを示す重要な節目となっている。
**トレンド4:SA構造的プレミアムの拡大**
南オーストラリアは最高のネガティブ価格頻度(48.4%)と最高の平均現物価格(2025年第4四半期VWAP $144/MWh)を同時に示しており、高い再生可能エネルギー普及率、不十分な柔軟発電容量または系統連系という構造的制約を反映している。
**トレンド5:タスマニア水力発電がシステムバッファとして機能**
タスマニアはNEM全体で一貫して最低のネガティブ価格頻度(0.2%〜9%)を記録しており、柔軟な水力発電容量がBasslink連系線を通じてシステム全体の安定化に貢献している。
**トレンド6:キャップ・リターンの上昇が持続的な価格変動リスクを示す**
NEM全体のキャップ・リターンが1年間で$36/MWhから$51/MWhへと上昇したことは、再生可能エネルギーの拡大による平均価格の低下にもかかわらず、高価格変動事象の頻度と強度が衰えていないことを示している。キャップ契約のヘッジ価値は引き続き上昇している。
## 7. 市場参加者への戦略的示唆
これらの構造的トレンドは、NEM参加者にとって重要な戦略的示唆をもたらす。
**BESSオペレーター**にとっては、日中ネガティブ価格の常態化が低コスト充電ウィンドウを提供し、熱波などの極端気象事象時の周期的な極端高価格が高価値の放電機会を生み出している。南オーストラリアの二極化した市場構造は、BESS裁定取引戦略にとって魅力的だが高リスクな場所となっている。
**電力小売業者および大口需要家**にとっては、キャップ・リターンの上昇が高価格ヘッジコストの増加を意味する。極端気象事象がより頻繁に発生する環境では、適切なキャップ契約カバレッジの維持がリスク管理の選択肢ではなく必須事項となっている。
**再生可能エネルギー開発者**にとっては、日中ネガティブ価格の構造的常態化が、蓄電池を併設しない太陽光発電プロジェクトの収益プロファイルを直接圧縮しており、統合型太陽光+蓄電池開発の商業的根拠を加速させている。
## まとめ
オーストラリアのNEMは、再生可能エネルギー主導の構造変化と、ますます頻繁化する極端気象事象によって特徴づけられる新たな市場時代に入っている。ネガティブ価格頻度の同時上昇と極端な高価格変動の持続は、すべての市場参加者に対して洗練されたリスク管理と戦略的ポジショニングを求める二極化した市場構造を生み出している。この構造的変革を理解することは、NEMで事業を展開する投資家、トレーダー、リスクマネージャーにとって不可欠である。
**データ出典:** AEMO四半期エネルギー動態(QED)レポート、2024年第1四半期〜2026年第1四半期。
Australia NEM Price Volatility and Extreme Weather Impacts: Quarterly Data Analysis 2024–2026
Australia's National Electricity Market (NEM) is undergoing a structural transformation of historic proportions. Data from the Australian Energy Market Operator's (AEMO) Quarterly Energy Dynamics (QED) reports, spanning nine quarters from Q1 2024 to Q1 2026, reveals an accelerating trend in negative price frequency that culminated in an all-time record of 31.0% in Q4 2025. Simultaneously, extreme weather events continue to drive periodic price spikes, creating a bifurcated market structure defined by sustained negative prices in the middle of the day and extreme high prices during peak demand periods.
## 1. NEM-Wide Negative Price Frequency Trend
A negative price occurs when the market clearing price falls below zero, typically during periods of high renewable generation — particularly solar — coinciding with low demand. The following table summarises NEM-wide negative price frequency across the nine quarters under review:
| Quarter | NEM-Wide Frequency | Notes |
|---------|-------------------|-------|
| Q1 2024 | 12.3% | First YoY decline (vs 12.5% prior year) |
| Q2 2024 | 7.0% | Down 2 pp YoY |
| Q3 2024 | 19.5% | Modest YoY increase |
| Q4 2024 | 23.1% | Record at the time |
| Q1 2025 | 18.0% | Up 5.6 pp YoY |
| Q2 2025 | 10.6% | Record Q2 high |
| Q3 2025 | 18.9% | Slight QoQ decline |
| **Q4 2025** | **31.0%** | **All-time record** |
| Q1 2026 | 14.9% | Down 3.0 pp YoY |
*Source: AEMO QED Q1 2024 through Q1 2026*

*Chart: NEM negative price frequency by region and NEM-wide total, Q1 2024 – Q1 2026. The NEM total (dark green, thick line) peaked at 31.0% in Q4 2025, with South Australia (red) reaching 48.4% in the same quarter. Dashed vertical line marks the NEM average (31.0%). Source: AEMO QED.*
The brief YoY decline in Q1 2024 proved to be a temporary reprieve rather than a structural reversal. From Q3 2024 onwards, the upward trajectory resumed with increasing momentum, culminating in Q4 2025 — the Australian summer — when nearly one in three dispatch intervals across the NEM cleared at a negative price.
## 2. Regional Breakdown of Negative Price Frequency
The NEM comprises five regions: Queensland (QLD), New South Wales (NSW), Victoria (VIC), South Australia (SA), and Tasmania (TAS). Structural differences in generation mix and interconnection capacity produce significant regional divergence in negative price exposure.
**Q4 2025 Regional Breakdown (Record Quarter):**
| Region | Negative Price Frequency |
|--------|--------------------------|
| South Australia (SA) | **48.4%** |
| Victoria (VIC) | 43.1% |
| Queensland (QLD) | 30.2% |
| New South Wales (NSW) | 26.7% |
| Tasmania (TAS) | 6.4% |
| **NEM Total** | **31.0%** |
South Australia's 48.4% frequency reflects the structural tension between its exceptionally high renewable penetration — particularly rooftop solar — and limited interstate interconnection capacity. Tasmania, by contrast, benefits from flexible hydroelectric generation that allows it to absorb surplus energy, resulting in a negative price frequency of just 6.4%.

*Chart: Comparison of negative price frequency (left) and VWAP (right) across the five NEM regions in Q4 2025. South Australia (SA) simultaneously records the highest negative price frequency (48.4%) and the highest VWAP ($144/MWh), illustrating the market's bifurcated structure. Source: AEMO QED Q4 2025.*
During daytime hours (0900–1700), negative price concentration is even more pronounced. In Q3 2024, Queensland's daytime negative price frequency reached 66% (up 13 percentage points YoY), while NSW reached 38% (up 5 pp). By Q1 2026, South Australia's daytime frequency had climbed to 67%, signalling that the daytime electricity market in high-solar regions has effectively entered a state of structural negative pricing.
## 3. Regional Average Spot Prices and Price Divergence
Rising negative price frequency does not translate uniformly into lower average prices. Regional average spot prices exhibit substantial divergence, with South Australia's structural premium remaining a defining feature of the NEM.
**Q1 2026 Regional Average Spot Prices:**
| Region | Average Price ($/MWh) | YoY Change |
|--------|----------------------|------------|
| Victoria (VIC) | $43 | -28% (lowest) |
| Queensland (QLD) | $65 | -27% |
| New South Wales (NSW) | $73 | -16% |
| South Australia (SA) | $88 | Increased YoY |
| Tasmania (TAS) | $94 | -15% (highest) |
**Q4 2025 Volume-Weighted Average Prices (VWAP):**
| Region | VWAP ($/MWh) |
|--------|-------------|
| Victoria (VIC) | $50 (lowest) |
| Queensland (QLD) | $69 |
| New South Wales (NSW) | $81 |
| Tasmania (TAS) | $95 |
| South Australia (SA) | **$144** (highest) |
South Australia's Q4 2025 VWAP of $144/MWh was nearly three times that of Victoria ($50/MWh), reflecting a combination of gas-dependent peaking capacity, limited interconnection, and frequent extreme weather events. This SA structural premium is a persistent feature of the NEM that has widened over the period under review.
## 4. High Price Events and Cap Return
Despite record-high negative price frequency, high-price events — intervals where prices approach or reach the market price cap — have not diminished in intensity. NEM-wide cap return (the value of $300/MWh cap contracts) rose from $36/MWh in Q1 2025 to $51/MWh in Q1 2026, an increase of $15/MWh, indicating that the hedging value of high-price protection has increased materially.
South Australia contributed $38/MWh of cap return in Q1 2026, the highest of any NEM region, further illustrating the bifurcated nature of the SA market: simultaneously exhibiting the highest negative price frequency and the highest peak price risk in the NEM.
## 5. Extreme Weather Event Case Studies
Extreme weather events serve as the primary catalyst for NEM price spikes. The following cases from 2024 through Q1 2026 illustrate the scale and nature of these impacts.
**January 2026 — NSW Heatwave**
On 10 January 2026, temperatures in Sydney exceeded 40°C. During the evening peak (1835–1920 hrs), NSW spot prices exceeded $10,000/MWh across nine consecutive dispatch intervals, reflecting the simultaneous surge in air-conditioning load and constrained supply.

*Chart: Intraday 5-minute dispatch interval prices for NSW and SA on 10 January 2026 (symlog scale). With Sydney reaching a maximum of 40.3°C, 9 dispatch intervals between 18:35–19:20 AEST exceeded $10,000/MWh, peaking at $16,100/MWh — near the market price cap of $16,600/MWh. SA recorded a sympathetic spike to $11,200/MWh. SA midday negative prices are also visible. Source: AEMO QED Q1 2026.*
**January 2026 — SA Heatwave**
In late January 2026, South Australia experienced an even more severe heatwave. During the evening peak (1930–2010 hrs), SA prices exceeded $17,000/MWh across six dispatch intervals, approaching the market price cap of $16,600/MWh. Significant price volatility also persisted through the early morning hours (0405–0820 hrs), indicating that supply-side stress extended well into the following day.
**November 2024 — NSW Heatwave**
In November 2024, temperatures in Sydney reached 39°C, driving demand approximately 2,000 MW above the peak November demand recorded in each of the preceding three years. Four coal units and one major gas unit were simultaneously offline, while transmission system constraints further tightened the supply-demand balance.
**October 2024 — SA Transmission Outage**
On 19 October 2024, extreme weather damaged several transmission towers in South Australia, causing a network outage that disconnected major industrial loads including Olympic Dam. The resulting supply disruption triggered significant price volatility across the SA region.
**Q1 2025 — Tropical Cyclone Alfred**
In late February and early March 2025, Tropical Cyclone Alfred made landfall on Australia's east coast, disrupting east coast gas markets and causing a decline in LNG production. The event temporarily affected electricity markets in Queensland and New South Wales as gas-fired generation capacity was constrained.
**August 2025 — Perth Cold Snap**
On 25 August 2025, Perth recorded its coldest winter day on record. The combination of surging heating demand and supply constraints led to extreme price events in the Western Australian electricity market.
## 6. Structural Trends
The nine-quarter dataset reveals six key structural trends reshaping the NEM:
**Trend 1: Solar Penetration Normalising Daytime Negative Prices**
The continued expansion of rooftop and utility-scale solar has made daytime negative pricing a structural feature rather than an anomaly. With SA daytime frequency at 67% and QLD at 66%, the traditional market pattern of higher daytime prices has been fundamentally inverted in high-solar regions.
**Trend 2: Accelerating Negative Price Trajectory**
Q4 2024's 23.1% was described as a record at the time; it was surpassed just one year later by Q4 2025's 31.0%. This acceleration indicates that renewable capacity additions are outpacing the market's ability to absorb surplus generation through demand response, storage, or interconnection.
**Trend 3: BESS Emerging as a Price-Setting Force**
In Q1 2026 Queensland, battery energy storage systems (BESS) set prices in more than 40% of dispatch intervals, a significant milestone indicating that BESS has transitioned from a price-taking arbitrageur to a structural price-setter in the market.
**Trend 4: SA Structural Premium Widening**
South Australia simultaneously exhibits the highest negative price frequency (48.4%) and the highest average spot prices (VWAP $144/MWh in Q4 2025), a combination that reflects the structural constraints of high renewable penetration without adequate flexible capacity or interconnection.
**Trend 5: Tasmanian Hydro as System Buffer**
Tasmania consistently records the lowest negative price frequency in the NEM (0.2%–9%), with its flexible hydroelectric capacity providing system-level stabilisation via the Basslink interconnector.
**Trend 6: Rising Cap Returns Signal Persistent Volatility Risk**
NEM-wide cap return rising from $36/MWh to $51/MWh over a single year indicates that despite lower average prices driven by renewable growth, the frequency and intensity of high-price volatility events has not abated. The hedging value of cap contracts continues to increase.
## 7. Strategic Implications for Market Participants
These structural trends carry significant strategic implications for NEM participants.
For **BESS operators**, the normalisation of daytime negative prices provides a reliable low-cost charging window, while periodic extreme price events — particularly during heatwaves — create high-value discharge opportunities. South Australia's bifurcated market structure makes it an attractive but high-risk venue for BESS arbitrage strategies.
For **electricity retailers and large consumers**, rising cap returns imply increasing costs for high-price hedging. In an environment of more frequent extreme weather events, maintaining adequate cap contract coverage has become a risk management necessity rather than an option.
For **renewable energy developers**, the structural normalisation of daytime negative prices directly compresses the revenue profile of solar projects without co-located storage, accelerating the commercial case for integrated solar-plus-storage development.
## Conclusion
Australia's NEM is entering a new market era defined by renewable-led structural change and punctuated by increasingly frequent extreme weather events. The simultaneous rise in negative price frequency and the persistence of extreme high-price volatility create a bifurcated market structure that demands sophisticated risk management and strategic positioning from all market participants. Understanding this structural transformation is essential for investors, traders, and risk managers operating in the NEM.
**Data sources:** AEMO Quarterly Energy Dynamics (QED) reports, Q1 2024 through Q1 2026.