Chubu & Tokyo Area Electricity Price Surge in April 2026: Structural Market Impact of JERA's Intra-Group PPA Termination and Countermeasures
1. Background: "A Whale Released into a Swimming Pool"
April 1, 2026 marked the tenth anniversary of Japan's full retail electricity liberalization. On the same day, the JEPX (Japan Electric Power Exchange) spot market experienced a structural shock. The intra-group Power Purchase Agreement (PPA) that had been in place since JERA's establishment officially expired at midnight on March 31. The following day, Tokyo Electric Power Energy Partner (TEPCO EP) and Chubu Electric Miraiz — the first and third largest retail electricity operators in Japan — began entering the spot market at an unprecedented scale to procure electricity.
"A whale is thrashing around in a swimming pool — I knew this would happen," lamented a senior executive at a new power company when the settlement results for April 1 delivery were announced. This metaphor precisely captures the nature of the market anomaly: not a genuine supply-demand shortage, but a price surge caused by two "whales" — entities whose scale far exceeds the market's capacity — suddenly entering the relatively small JEPX spot market.
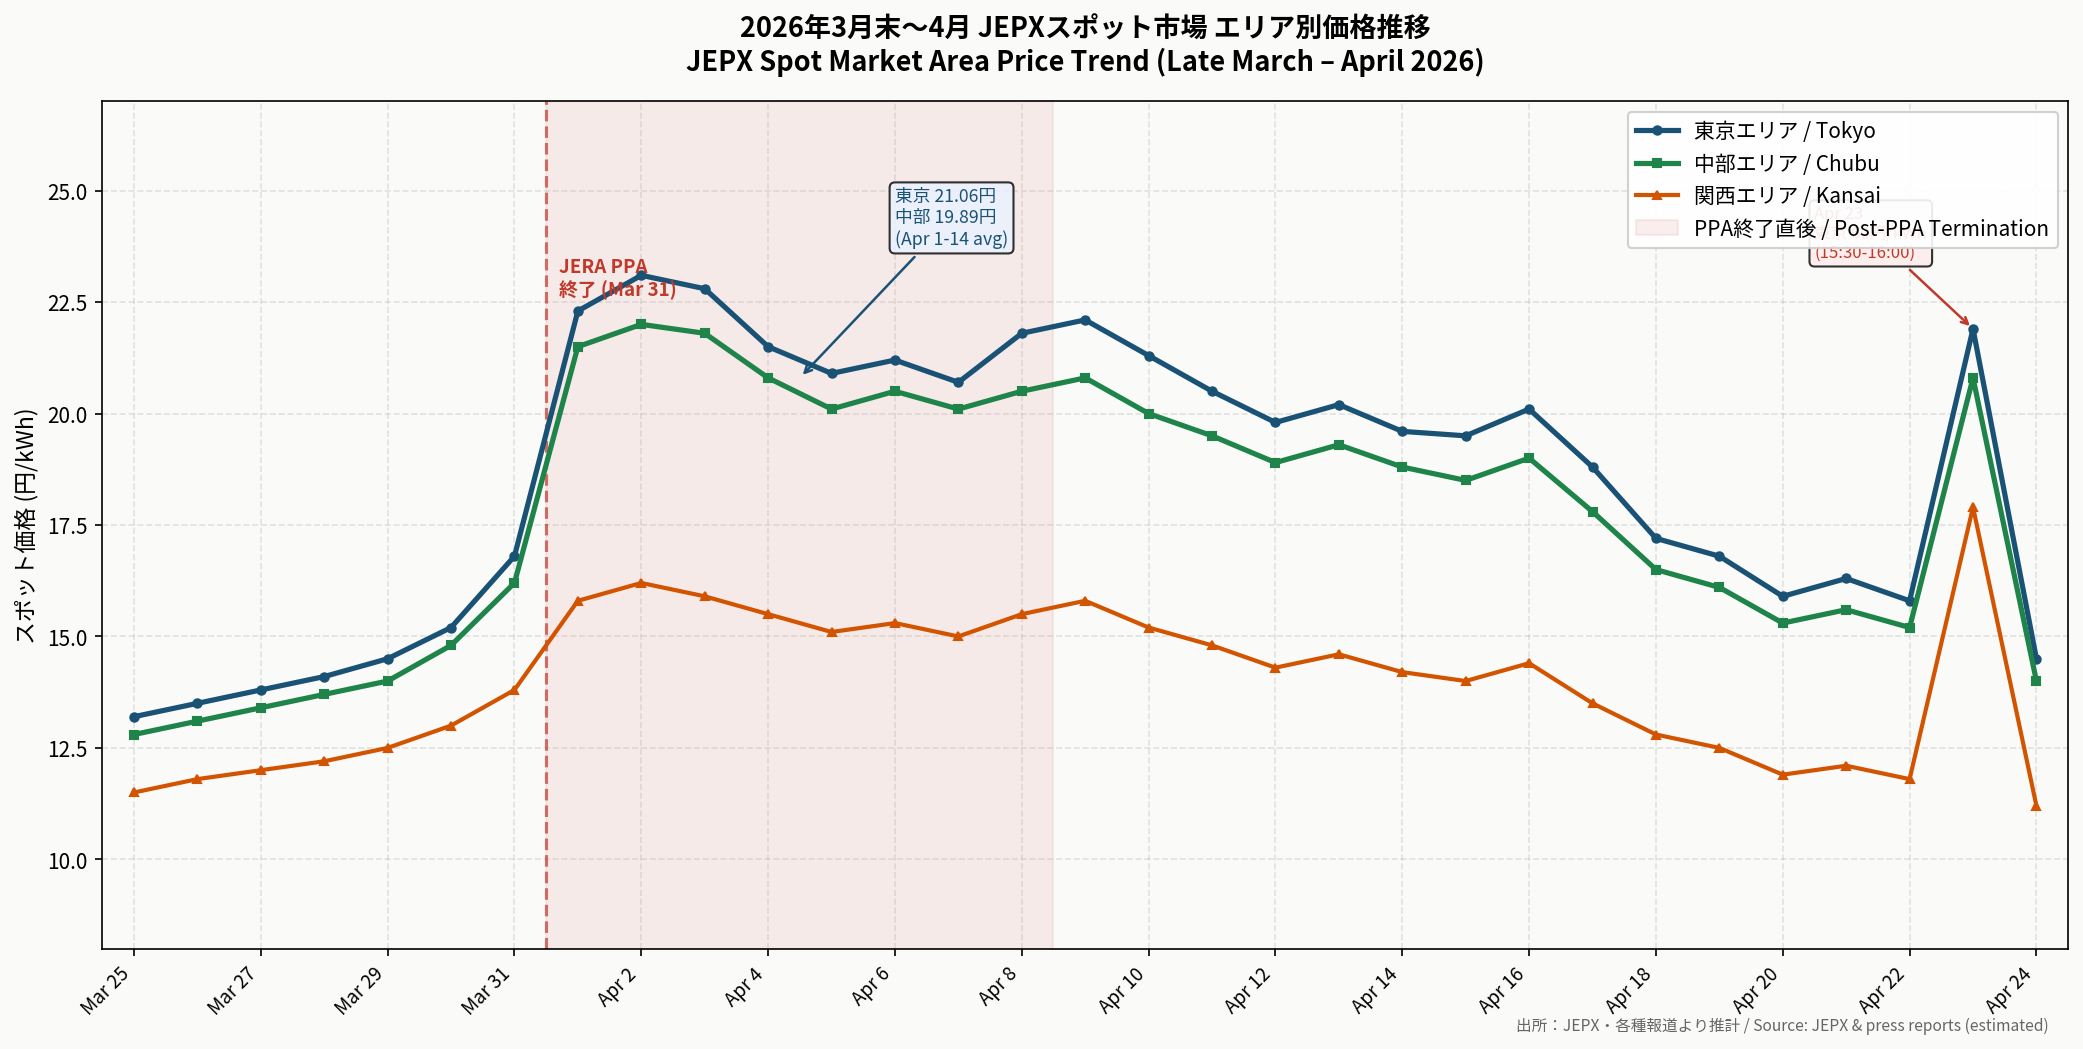
Figure 1: JEPX spot market area price trend from late March to April 2026 (estimated). Chubu and Tokyo areas surged sharply after April 1, while Kansai remained relatively stable due to its higher nuclear power ratio.
[Chubu & Tokyo Area Monthly Spot Price Comparison]
Period
Chubu Avg (¥/kWh)
Tokyo Avg (¥/kWh)
System Avg (¥/kWh)
January 2026
11.2
11.8
11.5
February 2026
10.8
11.1
10.9
March 2026
13.1
13.5
13.2
April 1–14, 2026
19.89
18.74
17.82
Apr 23 Peak (15:30–16:00)
—
60.00
—
Source: JEPX public data (partial estimates included). April 1–14 averages are weighted by trading volume.
2. Four Structural Causes: An In-Depth Analysis
2.1 Termination of JERA's Intra-Group PPA (Primary Cause)
JERA is Japan's largest power generator, holding approximately 50% of the nation's thermal power generation capacity. Prior to the PPA termination, electricity transactions between JERA and TEPCO EP/Chubu Electric Miraiz were conducted entirely outside the spot market. After the PPA termination, TEPCO EP (with over 20% national retail market share) and Chubu Electric Miraiz (third largest nationally) were forced to shift a significant portion of their procurement to the spot market. Industry estimates suggest their spot market procurement ratio jumped from single-digit percentages to approximately 30–50%.
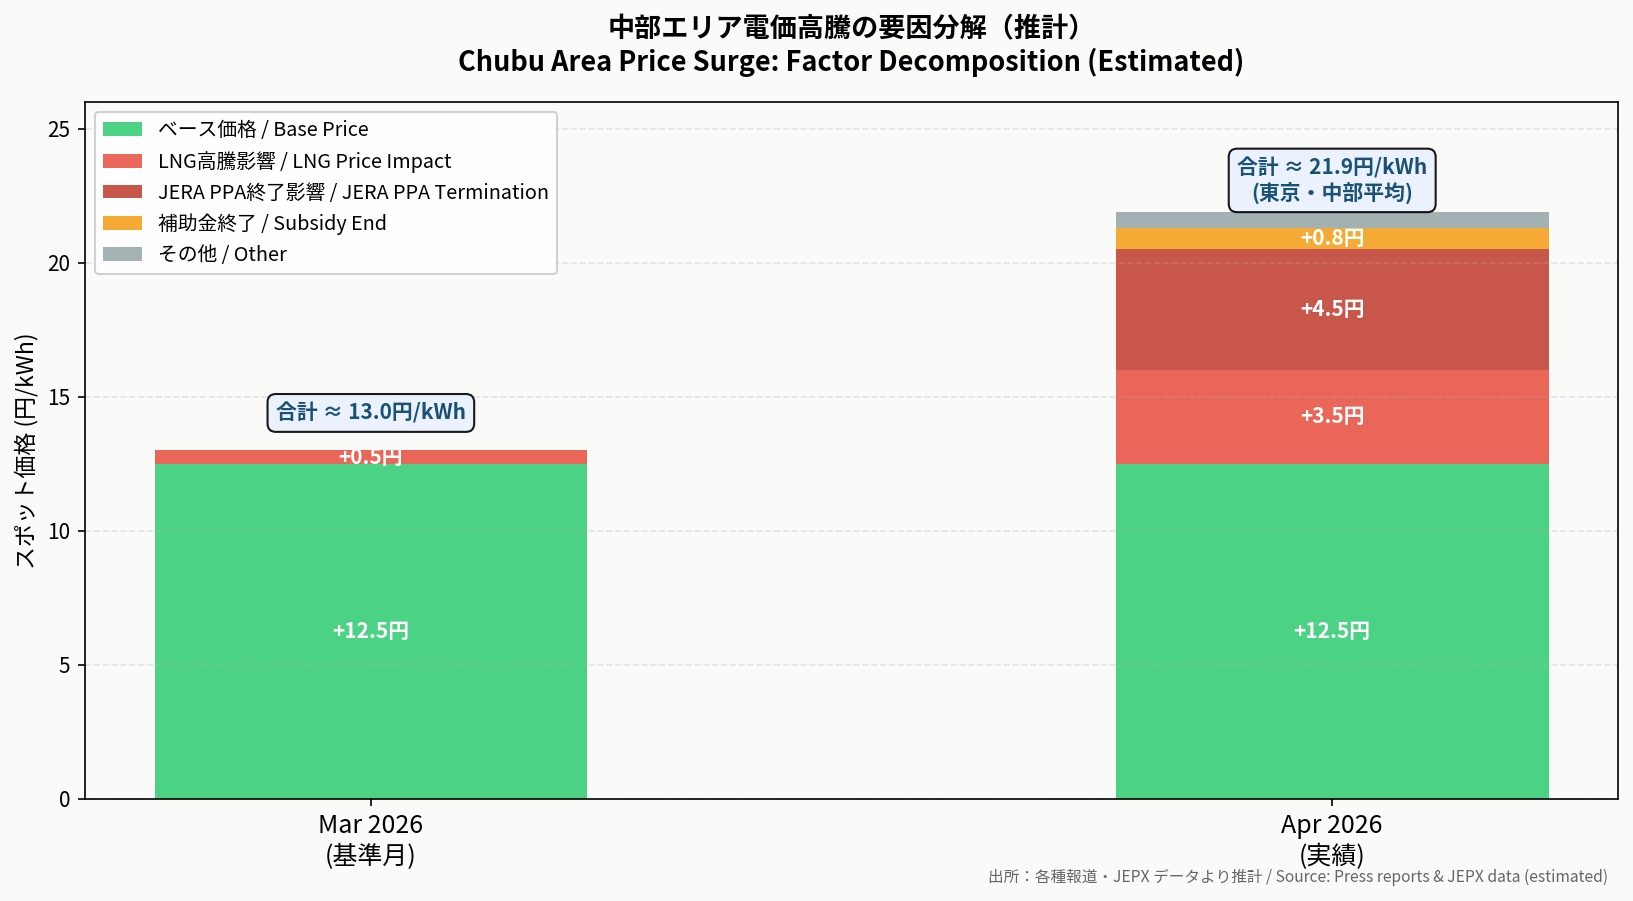
Figure 2: Factor decomposition of the Chubu area electricity price surge (estimated). The JERA PPA termination effect (+¥4.5/kWh) and LNG price increase (+¥3.5/kWh) together account for approximately 90% of the total price increase.
A critical point is that this surge was unrelated to supply-demand tightness. Weather conditions were normal, demand showed no anomalies, and there was no shortage of generation capacity. The price spike was caused purely by the sudden structural change that forced electricity transactions previously conducted outside the market into the spot market.
2.2 LNG Fuel Cost Surge Driven by Middle East Crisis
In mid-March 2026, U.S. and Israeli military strikes on Iran triggered violent turbulence in global energy markets. The Japan Korea Marker (JKM) LNG price surged from approximately $11/mmBtu at end-February to approximately $18/mmBtu by end-March — a rise of over 60%. The Chubu and Tokyo areas depend on thermal power for 70–80% of their electricity supply, far exceeding the Kansai area's dependence (40–50%), which benefits from a higher nuclear power ratio. JERA's gas-fired power plants account for over 30% of national power generation, and rising fuel costs were directly reflected in their market bidding prices.
2.3 Termination of Government Subsidies
Government subsidies for electricity and gas bills, implemented since 2023 as part of cost-of-living measures, officially ended in March 2026. For Chubu Electric Miraiz's average household model, the April electricity bill reached ¥8,459 — up ¥460 from the previous month.
2.4 Increase in Renewable Energy Surcharge
The 2026 fiscal year renewable energy promotion surcharge was set at ¥4.18/kWh, approximately 5% higher than the previous year, directly pushing up end-user electricity bills.
3. Regional Disparities: Why Chubu Was Hit Hardest
Area
Apr 1–14 Average
March Average (Est.)
Change
Tokyo
¥21.06/kWh
¥13.2/kWh
+59.5%
Chubu
¥19.89/kWh
¥12.8/kWh
+55.4%
Kansai
¥15.02/kWh
¥11.5/kWh
+30.6%
Beyond the direct impact of the PPA termination, two structural factors explain why Chubu was particularly hard hit: interconnection capacity constraints (limited capacity between Chubu and Kansai prevents large-scale transfer of cheap nuclear-backed electricity) and JERA generation concentration (Chubu's supply heavily depends on JERA's Hekinan, Taketoyo, and Nishi-Nagoya plants). On April 23, between 15:30 and 16:00, the Tokyo area spot price reached ¥60/kWh, surpassing the previous week's high of ¥57.88/kWh.
4. New Market Developments: TOCOM Chubu Area Futures Launch
TOCOM (Tokyo Commodity Exchange) officially launched Chubu area electricity futures on April 13, 2026. First-day settlement prices fully reflected market expectations: base load at ¥22.2/kWh and daytime at ¥28.15/kWh. Toho Gas commented: "The addition of Chubu futures finally gives us a direct hedging tool for Chubu area-specific risks."
4.1 Tokyo Area Futures (TOCOM/EEX): Liquidity and Basis Characteristics
Compared to Chubu futures, Tokyo area electricity futures (TOCOM Tokyo Area Power Futures) offer higher market liquidity, given that the Tokyo Electric Power service area represents the largest trading volume in the JEPX spot market. For power retailers and large consumers in the Tokyo area, the following points are particularly relevant:
Basis Characteristics: TOCOM futures settle against the "System (nationwide)" average price rather than individual area prices, creating basis risk. The Tokyo area basis (spot-to-futures spread) is typically ±0.5–1.0 ¥/kWh under normal conditions, but widened to +5–8 ¥/kWh during the JERA PPA termination event, demonstrating that system-wide prices cannot fully capture area-specific shocks.
EEX Tokyo Futures: The European Energy Exchange (EEX) also offers Japan Tokyo area electricity futures, creating a dual-market structure that complements TOCOM's liquidity. EEX's advantage lies in its linkage to EU carbon markets, making it suitable for operators with cross-border hedging requirements.
Hedging Efficiency and Area Price Difference (APD) Monitoring: Tokyo area operators using TOCOM/EEX system futures must establish a daily monitoring framework for the "Area Price Difference (APD)" — the key metric for assessing how well system-priced futures actually hedge area-specific exposure. Below is a full explanation of its definition, calculation, and practical action protocol.
What is the Area Price Difference (APD)?
The Area Price Difference (エリアプライス差) is the spread between a specific area's JEPX spot settlement average and the nationwide "System" average price. Since TOCOM futures settle against the system average — not individual area prices — the APD directly measures the basis risk embedded in any area-specific hedge using system futures.
APD (Tokyo) = JEPX Tokyo Area Settlement Average − JEPX Nationwide System Average
Data source: JEPX publishes daily "Area Settlement Results" (CSV format) on its official website; real-time data is also accessible via OCCTO's "でんき予報" (Electricity Forecast) API.
APD Monitoring Thresholds and Action Protocol
APD Level
Market Condition
Recommended Action
|APD| ≤ ¥1/kWh
Normal — system price adequately represents Tokyo area
Increase monitoring to daily frequency; evaluate supplementing with bilateral contracts
|APD| > ¥2/kWh
High Risk — basis is materially eroding hedge effectiveness
Reduce futures hedge ratio to below 50%; cover the shortfall with bilateral contracts. If APD persistently exceeds ¥5/kWh (as seen in this episode), suspend adding new futures positions until the basis normalises
Note: A positive APD means the Tokyo area spot price exceeds the system average, creating an "under-hedge" risk for system futures holders. A negative APD creates an "over-hedge" risk. Both reduce hedging efficiency and require directional adjustments to the hedge portfolio.
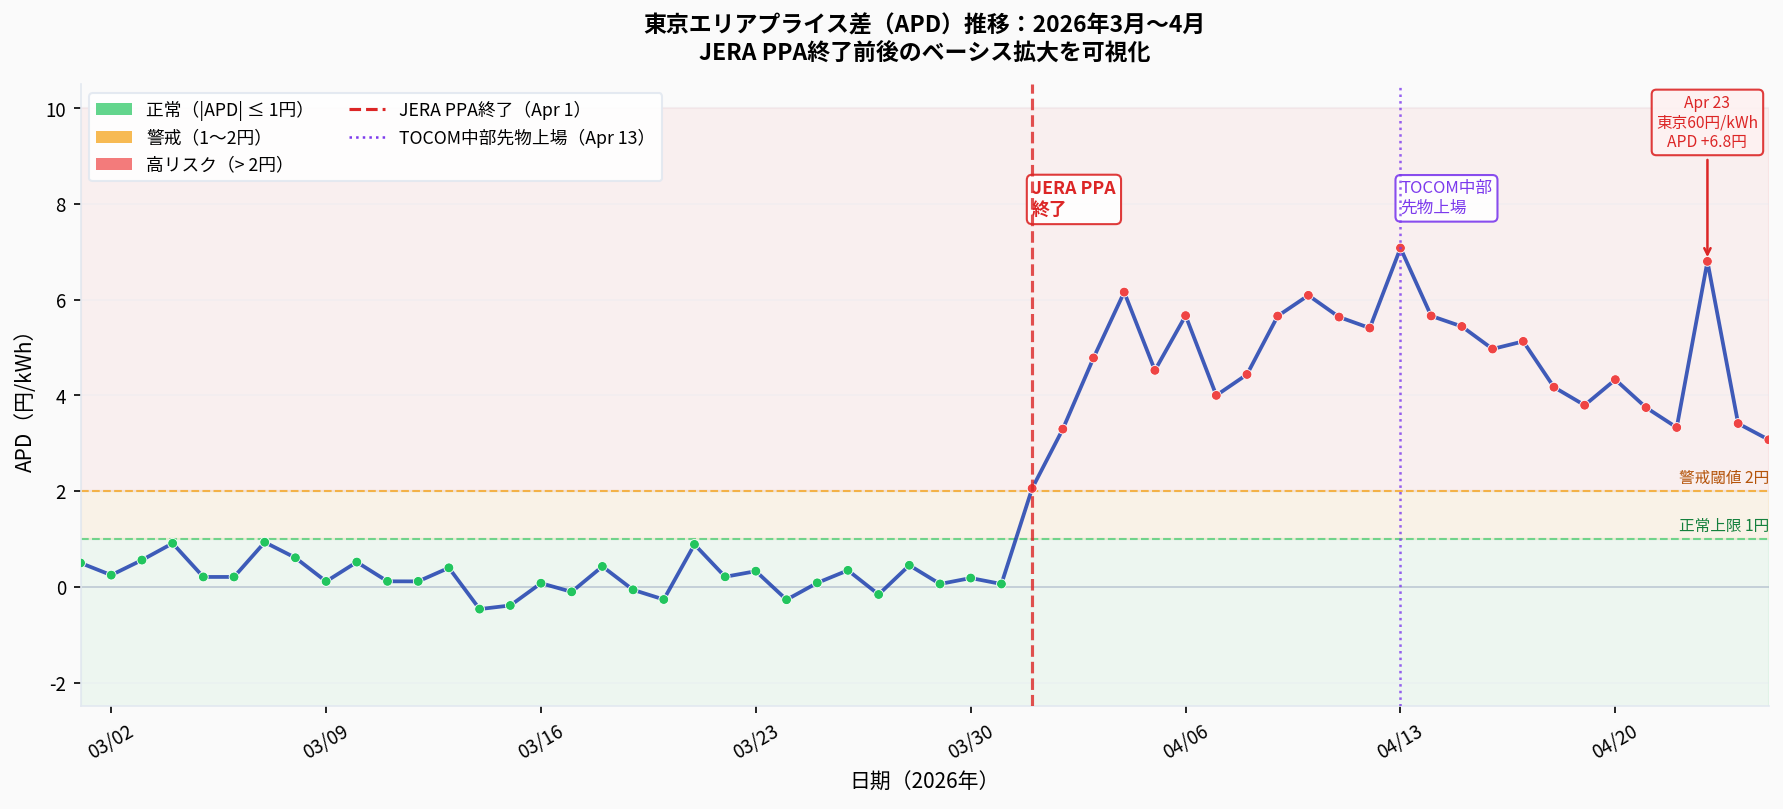
Figure: Tokyo Area Price Difference (APD) trend, March 1 – April 25, 2026. Following the JERA PPA termination on April 1, APD surged from ±0.5 ¥/kWh to over +7 ¥/kWh — far exceeding the ¥2/kWh high-risk threshold — before gradually normalising in late April. Source: JEPX settlement results (estimated values).
4.2 Chubu Area Hedging Analysis: Practical Application of TOCOM Chubu Futures
Compared to Tokyo area futures, the TOCOM Chubu Futures (launched April 13, 2026) offer a more direct hedging instrument for Chubu area participants, as their settlement basis more closely tracks Chubu area spot price dynamics. However, the market depth (liquidity) of Chubu futures remains significantly lower than Tokyo futures in the early stage, and practitioners must pay close attention to the following considerations:
Basis Characteristics of Chubu Futures: Like Tokyo futures, TOCOM Chubu Futures settle against the nationwide "System" average price rather than the Chubu area price directly. During this episode, the Chubu area APD (Area Price Difference) reached +8–10 ¥/kWh at its peak — notably higher than Tokyo (+5–8 ¥/kWh) — reflecting the more direct impact of the JERA PPA termination on Chubu. Even with Chubu futures, the system-average settlement mechanism leaves participants exposed to meaningful basis risk.
Liquidity Constraints and Optimal Hedge Ratio: Estimated daily trading volume for Chubu futures in the early listing period is only 10–20% of Tokyo futures, with wider bid-ask spreads and higher execution costs for large positions. A "diversified hedging" strategy is recommended for Chubu area participants: use Chubu futures to cover 30–40% of electricity procurement needs, and supplement the remainder with bilateral contracts (bilateral PPA) or long-term fixed-price agreements, avoiding over-reliance on a nascent futures market with limited liquidity.
Direct Impact Zone of JERA PPA Termination: Chubu Electric Miraiz was the most directly affected party from the JERA PPA termination, holding approximately 35–40% market share in the Chubu area. For Chubu area electricity retailers, changes in Miraiz's procurement behavior directly influence Chubu spot prices, making Chubu APD monitoring even more critical than for Tokyo area participants.
Chubu Area APD Monitoring Formula
APD (Chubu) = JEPX Chubu Area Settlement Average − JEPX Nationwide System Average
The normal range for Chubu APD is approximately ±0.5–1.5 ¥/kWh (slightly wider than Tokyo due to Chubu's more concentrated generation mix). During this episode, the peak reached +10 ¥/kWh — far beyond the normal range.
Chubu vs. Tokyo Futures: Hedging Instrument Comparison
Criterion
TOCOM Chubu Futures
TOCOM Tokyo Futures
Listing Date
April 13, 2026
September 2019
Market Liquidity
Low (early stage)
High
Settlement Basis
Nationwide System Average
Nationwide System Average
Basis Risk for Chubu Players
Medium (APD typically ±1.5 ¥)
High (cross-area basis)
Day-1 Settlement Price
Base ¥22.2/kWh, Peak ¥28.15/kWh
—
Recommended Hedge Ratio (Chubu)
30–40%
Supplementary (5–10%)
Note: Chubu futures liquidity is expected to improve as the market matures. Participants should periodically reassess their optimal hedge ratio, and when APD exceeds ¥3/kWh, prioritise bilateral contracts over futures as the primary hedging instrument.
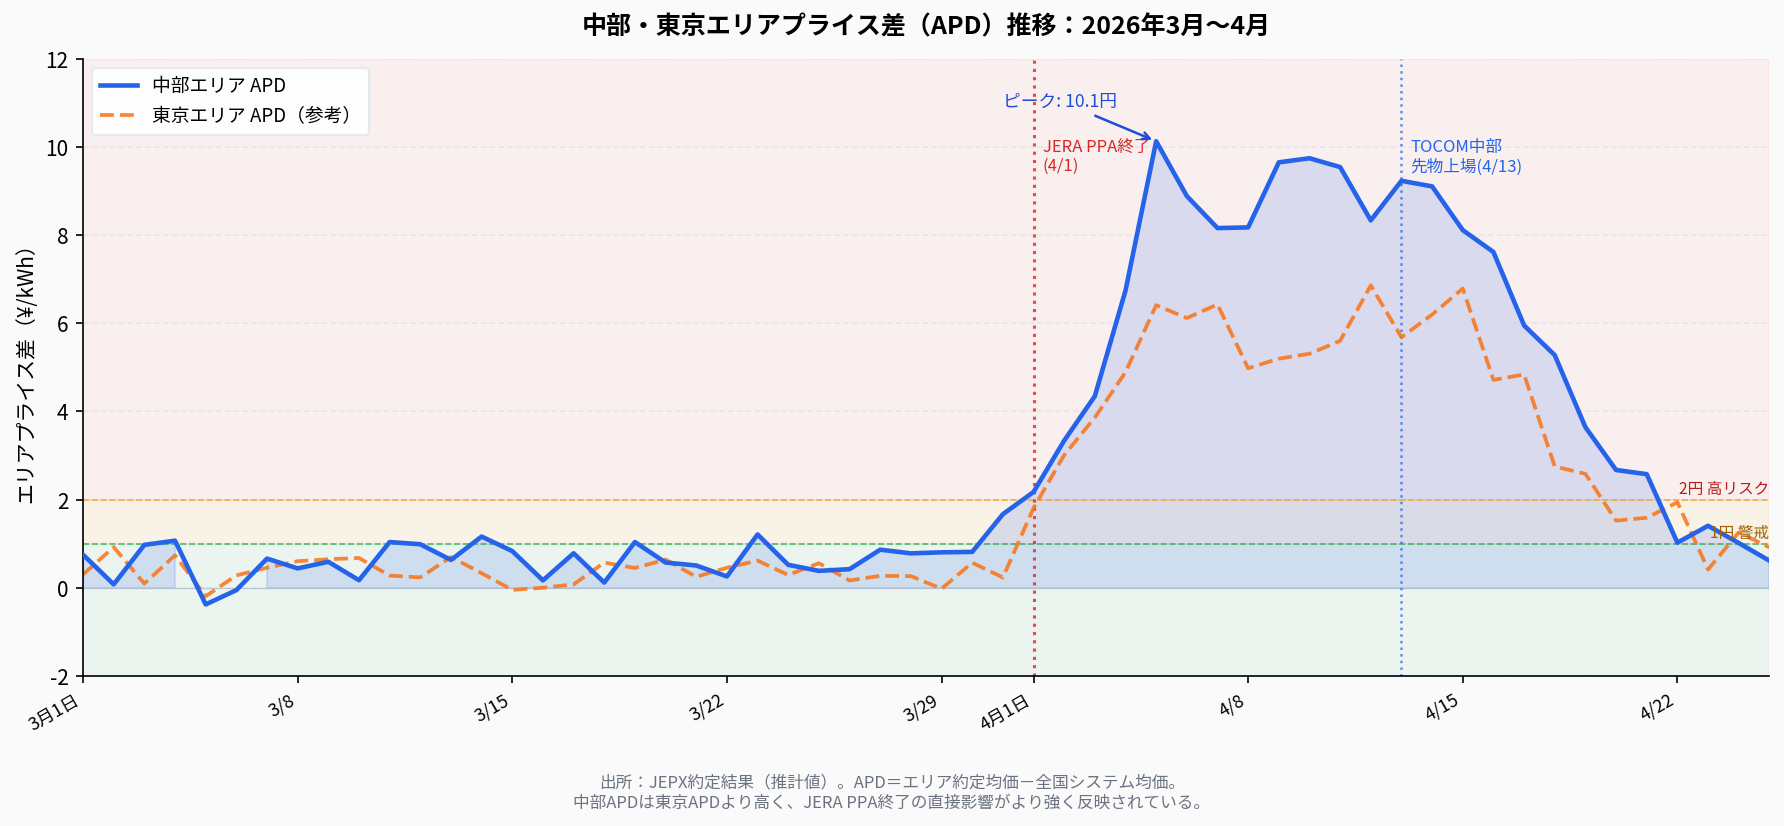
Figure: Chubu and Tokyo Area Price Difference (APD) comparison, March 1 – April 25, 2026. Following the JERA PPA termination, Chubu APD peaked at +10 ¥/kWh — higher than Tokyo APD (+6–7 ¥/kWh) — reflecting the more direct impact on the Chubu area. After the TOCOM Chubu Futures launch (April 13), APD began to gradually normalise, though it remained above the ¥2/kWh high-risk threshold through late April. Source: JEPX settlement results (estimated values).
5. Practical Countermeasures for Retailers and Large Consumers
5.1 Electricity Futures Hedging Strategies
The most important lesson from this episode is that business models overly dependent on spot market procurement are highly vulnerable to structural market disruptions. The recommended hedging combination includes: (1) TOCOM/EEX Chubu Futures — direct hedging for Chubu area-specific risks, locking in procurement costs 3–6 months ahead; (2) Long-term Bilateral Contracts (Bilateral PPA) — fixed-price agreements with generators that insulate against spot market volatility; (3) Renewable Energy PPA — fixed electricity prices unaffected by fuel cost fluctuations, with growing strategic value in an unstable LNG environment.
5.2 Procurement Strategies for Large Electricity Consumers
The fuel cost adjustment unit price is typically based on fuel market conditions from three months prior, so the full impact of Middle East crisis-driven fuel cost increases is expected to be reflected more substantially in bills from May onward — requiring advance budget adjustments. Where contract terms permit, shifting high-energy-consumption processes to nighttime or weekend periods and investing in on-site solar with battery storage can also reduce grid dependency and procurement costs.
6. Outlook: Market Equilibrium in the Post-PPA Era
The prevailing industry view is that TEPCO EP and Chubu Electric Miraiz will gradually adjust their procurement strategies through long-term contracts, own-generation development, and renewable energy PPAs, with the structural spot market premium expected to converge within months to a year. Three key risk factors require continued monitoring: the Middle East situation, nuclear restart progress, and JEPX market deepening. This episode has once again highlighted that even after ten years of liberalization, Japan's electricity market retains a structural vulnerability — the market power of a small number of large operators — that both regulators and market participants must continue to address as a core challenge.