日本需給調整市場調整力必要量全解析:FCR到RR-FiT的五商品架構、歷史趨勢與FY2030預測
什麼是調整力必要量?
「調整力必要量」是日本需給調整市場(EPRX)定期公告的核心數字——依據EPRX官方FAQ,OCCTO於每年年度末公告翌年度全年的必要量表,並於每月月末更新翌月的精算值。這個數字直接決定了BESS、抽水蓄能、可調度火力等靈活性資源的市場機會規模,代表各電力區域為維持供需平衡所需採購的調整力容量(MW)。這個數字直接決定了BESS、抽水蓄能、可調度火力等靈活性資源的市場機會規模。
調整力必要量由OCCTO(廣域系統運用推進機關)依照算定規則計算,再由EPRX(需給調整市場運用機關)公告並執行採購。其計算基礎是「殘餘需要」(Residual Demand)的統計分析——即扣除太陽能、風電等VRE出力後,仍需由可調度電源供應的需求量。
五商品架構:從毫秒到小時
日本需給調整市場將調整力分為五個商品,依應動時間由快到慢排列,形成完整的頻率響應鏈:
| 商品 | 日文名稱 | 應動時間 | 主要功能 | BESS適合度 |
|---|---|---|---|---|
| FCR(一次) | 一次調整力 | 數秒以內 | 頻率即時穩定(GF控制) | ★★★★★ |
| S-FRR(二次①) | 二次調整力① | 數十秒~數分鐘 | LFC信號響應,頻率恢復 | ★★★★☆ |
| FRR(二次②) | 二次調整力② | 數分鐘程度 | GC後的短週期供需平衡 | ★★★★☆ |
| RR(三次①) | 三次調整力① | 數分鐘~15分鐘 | GC後的長週期供需平衡 | ★★★☆☆ |
| RR-FiT(三次②) | 三次調整力② | 15分鐘以上 | 廣域供需調整、FIT出力偏差補正 | ★★★☆☆ |
FCR(一次調整力)是BESS最具競爭優勢的商品——其要求的毫秒級響應速度是傳統火力機組無法達到的,而BESS可在數百毫秒內完成從待機到全功率輸出的切換。
複合商品:FY2025 的重要新機制
FY2025 起,EPRX 新增「複合商品」(複合調整力)投標機制,允許 BESS 等靈活性資源將 FCR(一次)、S-FRR(二次①)、FRR(二次②)打包為單一投標單位,由系統自動分配各商品的實際出力比例。這對 BESS 而言具有三大優勢:
| 優勢 | 說明 |
|---|---|
| 收益最大化 | 系統依即時需求動態分配三商品出力,避免單一商品閒置 |
| 降低投標複雜度 | 一次投標覆蓋三個商品,減少運維人員操作負擔 |
| 提升中標機率 | 複合商品必要量通常高於單一商品,競爭相對分散 |
FY2026 日前市場轉型後,複合商品的投標時間窗口調整為前日 12:00–14:00,約定結果於前日 15:00 前公告。BESS 開發商在規劃系統容量時,應優先評估複合商品的適用性——4 小時以上的長時儲能系統在複合商品中的收益表現通常優於短時系統。
複合商品的投標方式
複合商品的投標採用「主商品 + 副商品(內數)」結構:
- 選定主商品:選擇應札可能量最大的商品作為主商品(例如:二次調整力①)
- 副商品全量投標:其他商品以主商品容量為上限,全量作為「內數」同時投標。例如,100 MW 的 BESS 以二次調整力①為主商品,可同時對一次調整力和三次調整力①各投標 100 MW(內數)
- 系統自動分配:EPRX 系統依各商品的即時必要量,自動決定最優的出力分配比例,確保一般送配電事業者的總採購成本最小化
複合商品的約定方法(不等時性原理)
複合約定的理論基礎是「不等時性」(Asynchronicity)——各商品的最大需求量不會同時發生,因此同一資源可在不同時段分別提供不同商品的調整力。約定價格機制如下:
| 項目 | 說明 |
|---|---|
| 約定單價 | 以主商品的市場約定單價為基準 |
| 上限價格(現行) | ¥19.51/ΔkW/30 分(一次〜二次①及複合商品) |
| 上限價格(FY2026 改革後) | ¥7.21/ΔkW/30 分(全商品統一,降幅約 63%) |
| 結算基礎 | 約定容量(ΔkW)× 約定單價 × 約定時段數 |
複合商品的應動規則
獲得複合商品約定後,BESS 須依照 EPRX 的即時指令提供調整力:
- 一次調整力(FCR):頻率偏差觸發自動應動,無需接收中央指令,響應時間 ≤ 30 秒,持續時間 ≥ 5 分鐘
- 二次調整力①(S-FRR):接收 LFC 指令後 5 分鐘內完成出力調整,持續時間 ≥ 5 分鐘
- 三次調整力①(RR):接收 EDC 指令後 15 分鐘內完成出力調整,持續時間 ≥ 30 分鐘
- 優先順序:當多個商品同時收到指令時,依一次 > 二次① > 三次①的優先順序執行,系統確保不超過設備額定容量
複合 vs 單一商品:收益比較
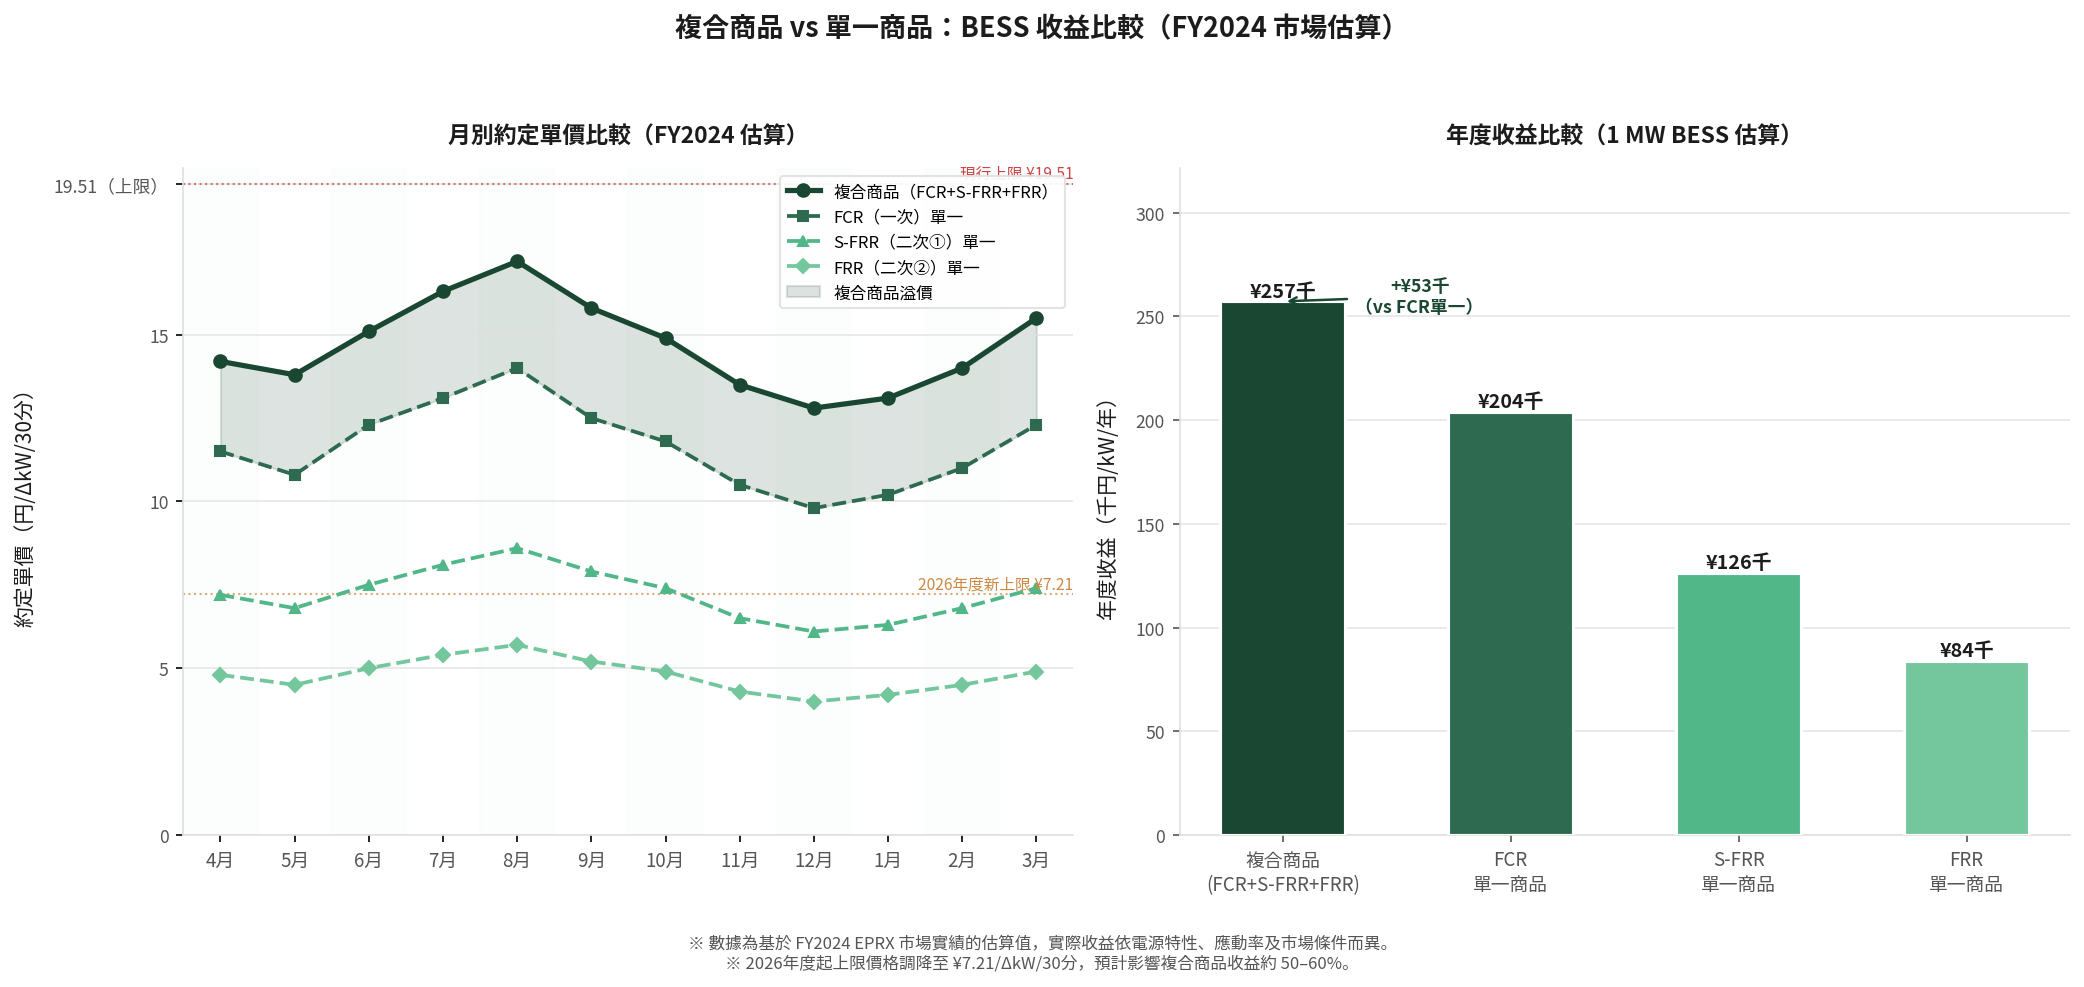
下圖比較 100 MW BESS 在複合商品與單一商品投標策略下的年度預期收益(基於 FY2024 市場數據):
調整力必要量的計算方法
OCCTO的算定公式以「殘餘需要元數據」為基礎,分別計算各商品的必要量:
| 商品 | 算定基礎 | 統計指標 |
|---|---|---|
| FCR(一次) | 殘餘需要的極短週期成分(Cyclic分) | 3σ相當值 + 單機最大容量系統比例值 |
| S-FRR(二次①) | 殘餘需要的短週期成分(Fringe分) | LFC信號的標準偏差 |
| FRR(二次②) | GC前後的時間內變動(Sustained分・短) | 30分鐘コマ間差分的3σ |
| RR(三次①) | GC前後的時間內變動(Sustained分・長) | 連續コマの累積偏差 |
| RR-FiT(三次②) | FIT出力預測誤差 + 廣域予備率 | 廣域予備率閾值12%觸發追加採購 |
值得注意的是,RR-FiT的追加採購並非每次都會觸發——只有當廣域予備率預測低於12%時,才會在前日市場追加採購。FY2024的數據顯示,週間市場採購量全國平均為4.9%,前日追加採購量平均為4.2%。
FY2021–FY2025:市場從零到全面運轉
日本需給調整市場的建立是一個分階段推進的過程。2021年4月,RR-FiT(三次②)率先開市,這是唯一一個在當時已有交易基礎的商品。此後,市場逐步擴展:
| 時間 | 里程碑 | 全國必要量(概估) |
|---|---|---|
| 2021年4月 | RR-FiT(三次②)開市 | 約1,500 MW/日 |
| 2022年4月 | FRR(二次②)、RR(三次①)開市 | 約3,200 MW/日 |
| 2023年4月 | S-FRR(二次①)開市 | 約4,800 MW/日 |
| 2024年4月 | FCR(一次)開市,五商品全面運轉 | 約7,200 MW/日 |
| 2025年度 | VRE滲透率提升,必要量持續增加 | 約8,000 MW/日 |
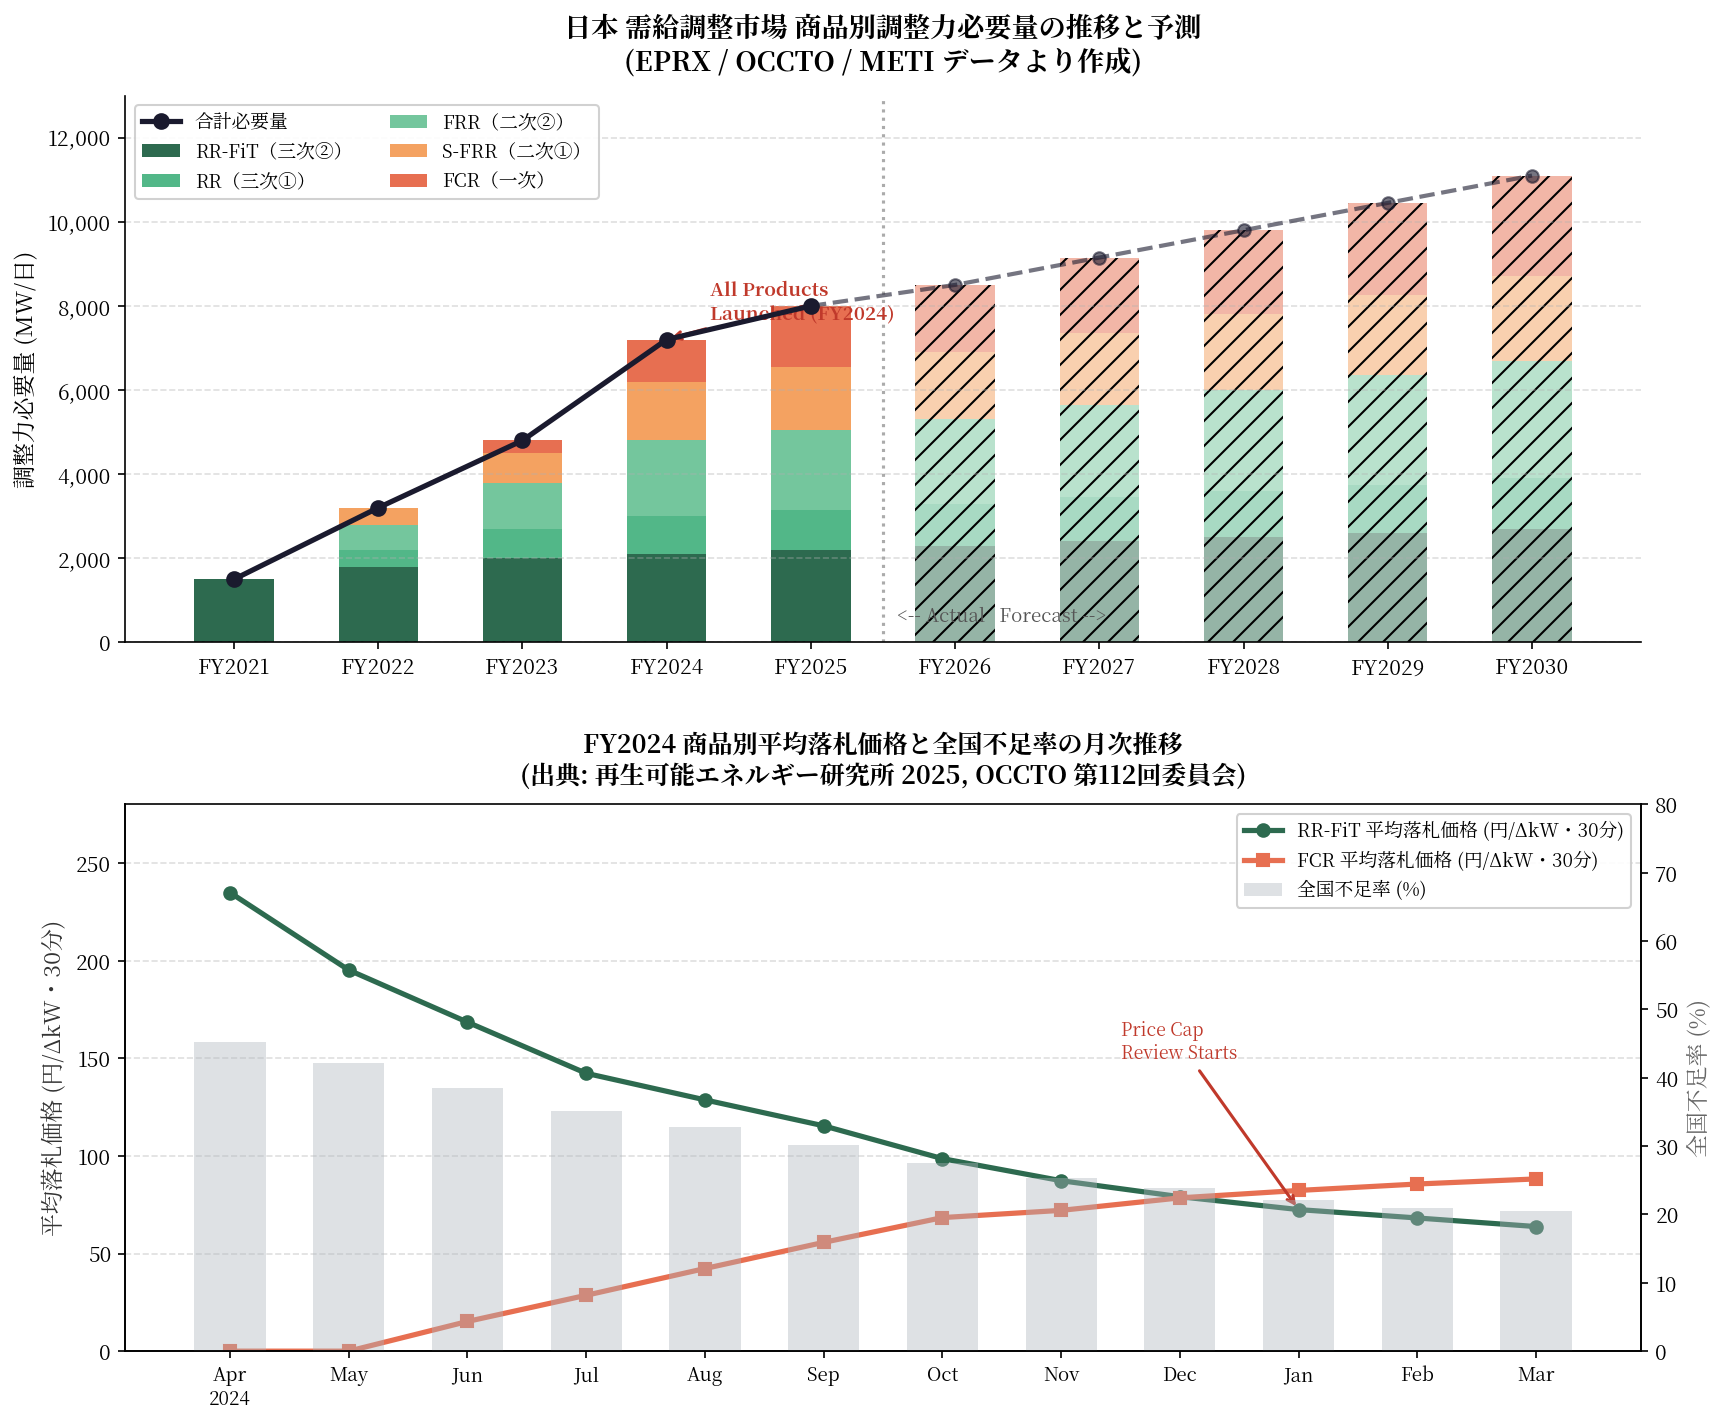
下圖呈現了FY2021至FY2025的各商品必要量堆疊,以及FY2026至FY2030的預測趨勢(斜線填充部分):
出處:OCCTO委員會文件、METI報告、再生可能エネルギー研究所(2025)
調整力必要量 vs BESS 系統連系容量的對比
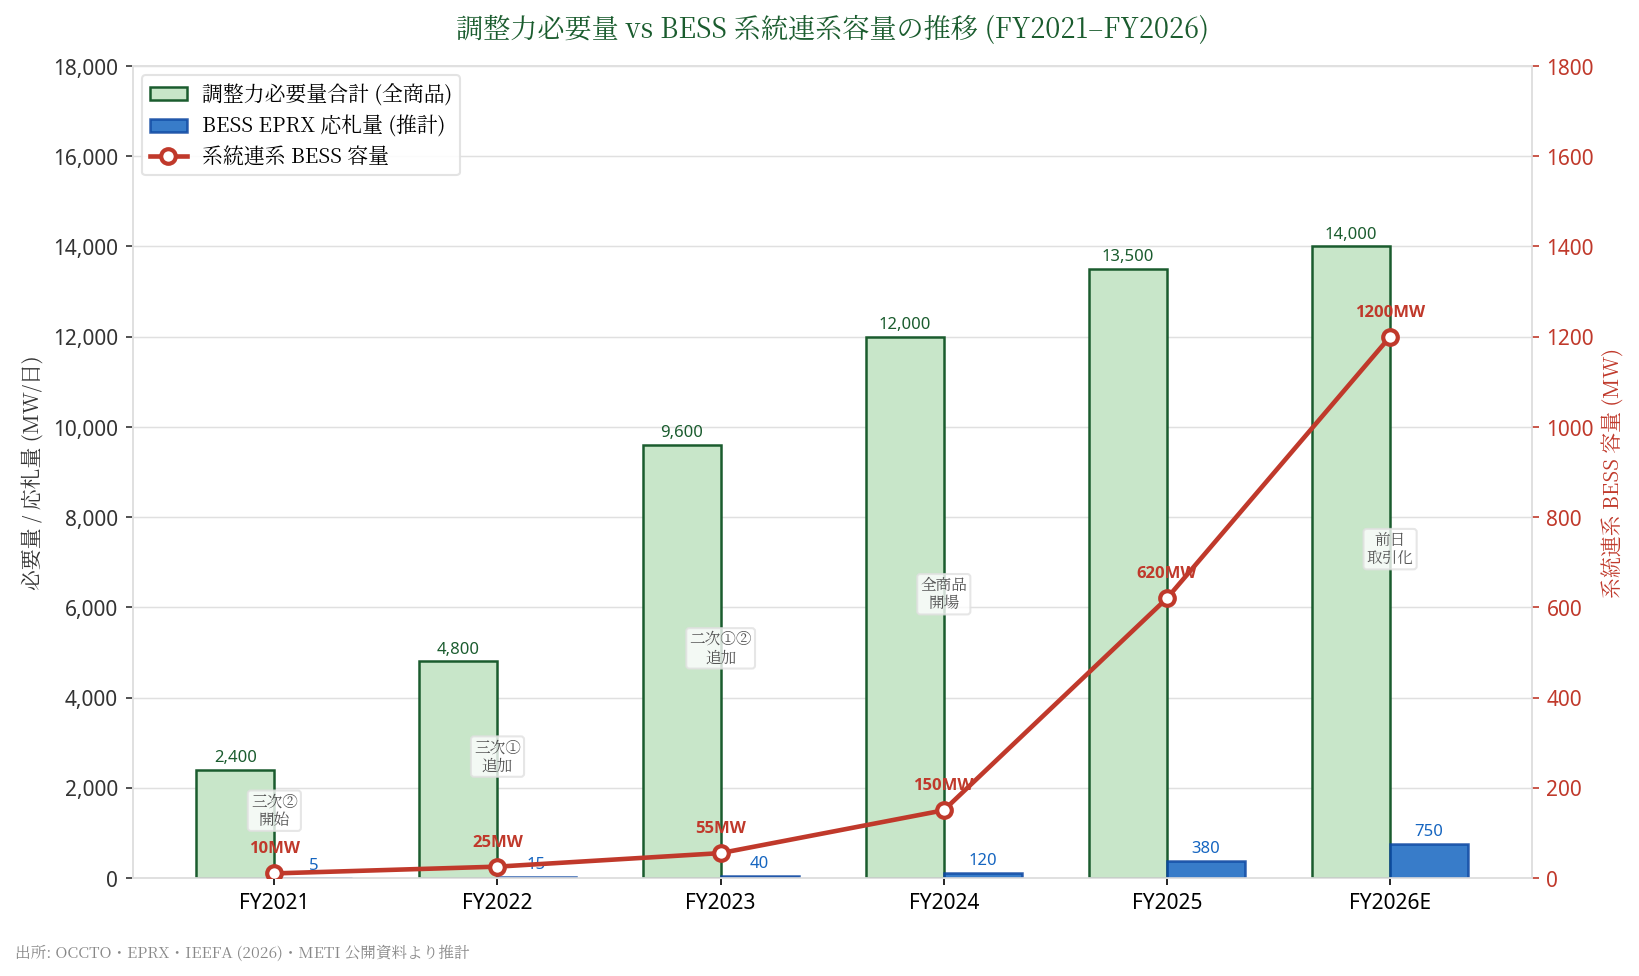
下圖對比了FY2021至FY2026年間調整力必要量的增長與BESS系統連系容量的增長,清晰呈現「市場需求遠超供給」的結構性缺口:
出處:OCCTO・EPRX・IEEFA(2026)・METI 公開資料推算
截至2025年底,日本系統連系BESS容量僅約620 MW,而全國調整力必要量已達約13,500 MW/日。即使考慮到BESS可同時參與多個商品,供需缺口仍然巨大。IEEFA預測,隨著LTDA長期合約BESS項目陸續投運,FY2026至FY2028年間系統連系BESS容量將快速增長至1,200 MW以上,但仍遠低於市場需求。
FY2024的市場動態:RR-FiT崩落,FCR崛起
FY2024是需給調整市場最戲劇性的一年。4月FCR開市後,市場參與者迅速發現了套利機會:
- RR-FiT(三次②):2024年4月平均落札價格達234.89円/ΔkW・30分,但隨著BESS大量入市,價格在12個月內跌至約63円——跌幅超過73%。
- FCR(一次):作為BESS最具優勢的商品,FCR從4月的幾乎零成交,到年末平均落札價格攀升至約88円/ΔkW・30分,成為新的收益支柱。
- 全國不足率:FY2024全年平均不足率約28.5%,意味著市場上有近三成的必要量未能在週間市場找到合格賣方,需要在前日市場追加採購或動用備用手段。
這種「RR-FiT崩落、FCR崛起」的格局,正是日本BESS投資者需要深刻理解的市場結構轉變。
FY2026:日前市場全面轉型
2026年度起,需給調整市場將進行重大制度改革:所有商品從週間市場轉為日前市場交易。這意味著:
- 採購頻率從每週一次變為每日一次,BESS運營商需要更頻繁地參與競標。
- 價格發現機制更加即時,短期供需變化對落札價格的影響將更顯著。
- 與現貨市場(JEPX)的協同套利策略將更加複雜,需要更精密的出力計劃管理。
此外,METI正在討論將需給調整市場與容量市場整合為「同時市場」(Simultaneous Market)的長期規劃,預計2030年代實施。這一改革將從根本上改變BESS的收益結構。
各區域必要量的差異:為何九州如此特殊?
調整力必要量在各電力區域之間存在顯著差異,這主要反映了各區域的VRE滲透率和負荷規模:
| 區域 | 特徵 | FCR必要量特點 | BESS機會評估 |
|---|---|---|---|
| 九州 | 太陽能滲透率全國最高,頻繁出力抑制 | 高,且季節性波動大(春季最高) | ★★★★★ |
| 東京 | 最大負荷區域,需求基盤穩定 | 高(絕對量最大) | ★★★★☆ |
| 中部 | 工業負荷為主,VRE滲透率中等 | 中等 | ★★★☆☆ |
| 關西 | 核電再稼動後VRE調整需求增加 | 中等,但增長趨勢明顯 | ★★★★☆ |
| 北海道 | 風電比例高,但聯絡線容量受限 | 相對高(孤立系統特性) | ★★★★☆ |
九州區域的特殊性值得特別關注:由於太陽能裝機密度極高(2025年春季最高瞬間滲透率超過100%),九州電力頻繁實施出力抑制(curtailment),導致殘餘需要的波動性遠高於其他區域,因此FCR和S-FRR的必要量相對於負荷規模而言特別高。
九大區域調整力必要量明細(FY2026估算,MW/日)
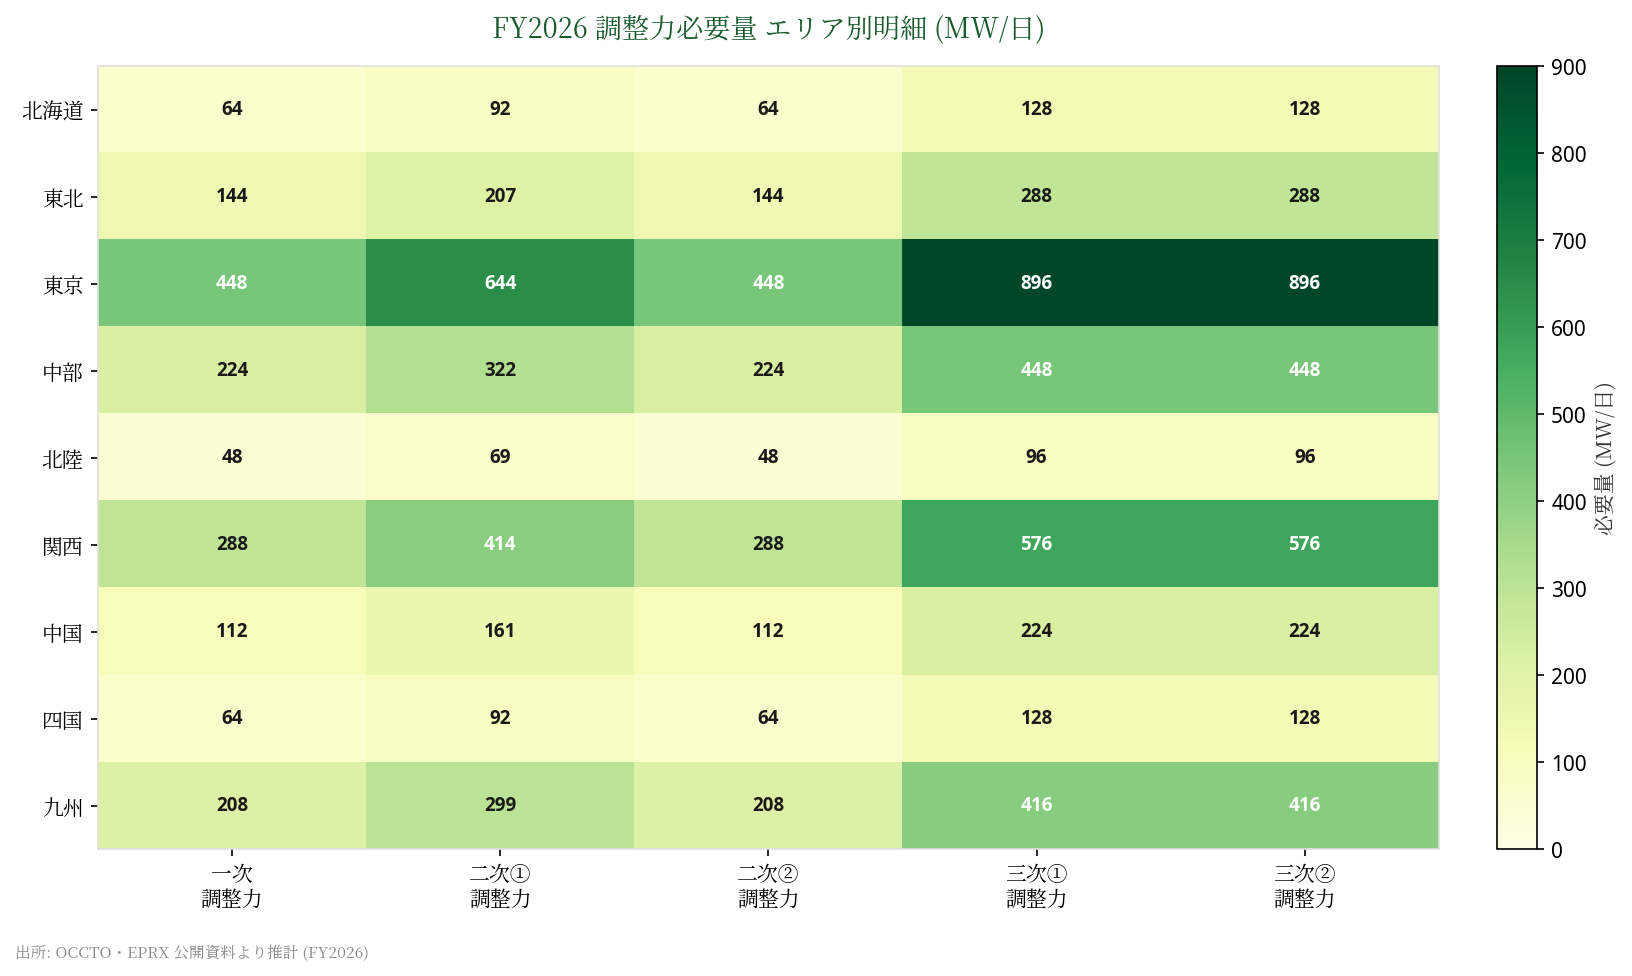
以下熱力圖呈現九個電力區域在五種調整力商品上的必要量估算值(MW/日),數據基於OCCTO公開資料按區域負荷份額比例推算:
出處:OCCTO・EPRX 公開資料按負荷份額比例推算
| 區域 | 一次(FCR) | 二次①(S-FRR) | 二次②(FRR) | 三次①(RR-FiT) | 三次②(RR) | 合計 |
|---|---|---|---|---|---|---|
| 北海道 | 64 | 92 | 64 | 128 | 128 | 476 |
| 東北 | 144 | 207 | 144 | 288 | 288 | 1,071 |
| 東京 | 448 | 644 | 448 | 896 | 896 | 3,332 |
| 中部 | 224 | 322 | 224 | 448 | 448 | 1,666 |
| 北陸 | 48 | 69 | 48 | 96 | 96 | 357 |
| 關西 | 288 | 414 | 288 | 576 | 576 | 2,142 |
| 中國 | 112 | 161 | 112 | 224 | 224 | 833 |
| 四國 | 64 | 92 | 64 | 128 | 128 | 476 |
| 九州 | 208 | 299 | 208 | 416 | 416 | 1,547 |
| 全國合計 | 1,600 | 2,300 | 1,600 | 3,200 | 3,200 | 11,900 |
東京區域的絕對量最大(全國約28%),但九州的「必要量/負荷比」最高,反映其極高的VRE滲透率。北陸和四國的絕對量最小,但受限於聯絡線容量,其孤立系統特性使BESS的邊際價值更高。
BESS投資者的策略啟示
理解調整力必要量的計算邏輯,對BESS投資者有以下直接啟示:
| 維度 | 關鍵洞察 | 策略建議 |
|---|---|---|
| 商品選擇 | FCR收益最穩定,但需要5分鐘以內的快速響應能力 | 優先配置FCR能力,系統設計需確保≤5秒響應 |
| 區域選擇 | 九州、北海道的必要量/負荷比最高 | 優先考慮九州和北海道的選址,但需評估聯絡線限制 |
| 容量規格 | FRR(二次②)要求持續放電能力,RR-FiT需要15分鐘以上響應 | 2小時以上的儲能時長可覆蓋更多商品,提高收益多樣性 |
| 市場時機 | FY2026日前市場轉型將增加運營複雜度 | 提前建立自動化競標系統,避免人工操作的時間成本 |
| 收益預測 | RR-FiT價格已大幅下跌,FCR成為新支柱 | 商業計劃應以FCR+現貨套利為主要收益來源,RR-FiT作為補充 |
結語:必要量上升是結構性趨勢
從FY2021的約1,500 MW到FY2024的約7,200 MW,日本需給調整市場的規模在三年內增長了近五倍。這一趨勢的根本驅動力是VRE滲透率的持續上升——太陽能和風電的出力波動性越高,電力系統所需的調整力就越多。
根據METI的再生能源路線圖,日本計劃在2030年前將VRE比例提升至36-38%,這意味著調整力必要量將繼續增長。預測顯示,到FY2030年,全國調整力必要量可能突破11,000 MW/日,相當於FY2024水準的1.5倍以上。
對於BESS投資者而言,這不僅是一個市場機會,更是一個結構性的長期趨勢。在日本電力系統從「化石燃料主導」向「VRE主導」轉型的過程中,BESS所扮演的調整力角色將越來越不可或缺。
參考來源
需給調整市場 調整力必要量の全解析:FCRからRR-FiTまでの5商品アーキテクチャ・歴史的推移・FY2030予測
調整力必要量とは何か?
「調整力必要量」とは、需給調整市場(EPRX)が定期的に公告する中核的な数値であり、各電力エリアが需給バランスを維持するために調達が必要な調整力容量(MW)を示す。EPRXの公式FAQによれば、OCCTOは年度末に翌年度1年分の必要量テーブルを公表し、月末に翌月分の精算値を更新する。この数値が、BESS・揚水発電・調整可能な火力発電などの柔軟性リソースの市場機会規模を直接決定する。
調整力必要量はOCCTO(広域系統運用推進機関)が算定規則に基づいて計算し、EPRX(需給調整市場運用機関)が公告・調達を実施する。算定の基礎は「残余需要」(Residual Demand)の統計分析——太陽光・風力などVREの出力を差し引いた後、調整可能電源が供給すべき需要量の変動特性である。
5商品アーキテクチャ:ミリ秒から時間まで
需給調整市場は調整力を応動時間の速い順に5商品に分類し、完全な周波数応答チェーンを形成している:
| 商品 | 応動時間 | 主な機能 | BESS適合度 |
|---|---|---|---|
| 一次調整力(FCR) | 数秒以内 | 周波数即時安定(GF制御) | ★★★★★ |
| 二次調整力①(S-FRR) | 数十秒〜数分 | LFC信号応答、周波数回復 | ★★★★☆ |
| 二次調整力②(FRR) | 数分程度 | GC後の短周期需給バランス | ★★★★☆ |
| 三次調整力①(RR) | 数分〜15分 | GC後の長周期需給バランス | ★★★☆☆ |
| 三次調整力②(RR-FiT) | 15分以上 | 広域需給調整・FIT出力偏差補正 | ★★★☆☆ |
FCR(一次調整力)はBESSが最も競争優位を持つ商品だ。従来の火力機組では不可能なミリ秒レベルの応答速度が求められ、BESSは数百ミリ秒以内に待機状態から全力出力への切り替えを完了できる。
複合商品:FY2025の重要な新メカニズム
FY2025より、EPRXは「複合調整力」の入札メカニズムを導入した。これにより、BESSなどの柔軟性リソースがFCR(一次)・S-FRR(二次①)・FRR(二次②)を一つの入札単位としてまとめて応札できるようになり、システムが各商品への実際の出力配分を自動的に決定する。BESSにとって3つの主要なメリットがある:
| メリット | 説明 |
|---|---|
| 収益最大化 | システムがリアルタイムの需要に応じて3商品の出力を動的に配分し、単一商品の遊休を防止 |
| 入札の簡素化 | 1回の入札で3商品をカバーし、運用担当者の負担を軽減 |
| 約定確率の向上 | 複合商品の必要量は単一商品より通常高く、競争が分散される |
FY2026の前日取引化移行後、複合商品の入札受付時間は前日12:00〜14:00に調整され、約定結果は前日15:00までに公告される。BESS開発事業者はシステム容量を計画する際、複合商品の適用可能性を優先的に評価すべきだ——4時間以上の長時間蓄電システムは、複合商品において短時間システムより優れた収益性を示す傾向がある。
複合商品の入札方法
複合商品の入札は「主商品+副商品(内数)」の構造を採用する:
- 主商品の選定:応札可能量が最も大きい商品を主商品として選択(例:二次調整力①)
- 副商品の全量入札:他の商品は主商品容量を上限として「内数」として全量同時入札。例えば100MWのBESSが二次調整力①を主商品とした場合、一次調整力・三次調整力①にも各100MW(内数)として同時入札可能
- システムによる自動配分:EPRXシステムが各商品の瞬時必要量に応じて最適な出力配分比率を自動決定し、一般送配電事業者の総調達コストを最小化
複合商品の約定方法(不等時性の原理)
複合約定の理論的根拠は「不等時性」(Asynchronicity)にある。各商品の最大必要量が発生するタイミングは必ずしも一致しないため、同一リソースが異なる時間帯に異なる商品の調整力を提供できる。約定価格メカニズムは以下のとおり:
| 項目 | 説明 |
|---|---|
| 約定単価 | 主商品の市場約定単価を基準とする |
| 上限価格(現行) | ¥19.51/ΔkW/30分(一次〜二次①および複合商品) |
| 上限価格(FY2026改革後) | ¥7.21/ΔkW/30分(全商品統一、約63%引き下げ) |
| 精算基礎 | 約定容量(ΔkW)× 約定単価 × 約定コマ数 |
複合商品の応動ルール
複合商品の約定後、BESSはEPRXのリアルタイム指令に従い調整力を提供する:
- 一次調整力(FCR):周波数偏差による自動応動、中央指令不要、応答時間≤30秒、継続時間≥5分
- 二次調整力①(S-FRR):LFC指令受信後5分以内に出力調整完了、継続時間≥5分
- 三次調整力①(RR):EDC指令受信後15分以内に出力調整完了、継続時間≥30分
- 優先順位:複数商品に同時指令が発出された場合、一次>二次①>三次①の優先順位で実行、設備定格容量を超えないようシステムが管理
複合商品 vs 単一商品:収益比較
下図は100MW BESSが複合商品と単一商品の入札戦略を採用した場合の年間期待収益比較(FY2024市場データ基準):
調整力必要量の算定方法
OCCTOの算定式は「残余需要元データ」を基礎とし、各商品の必要量を個別に算出する:
| 商品 | 算定基礎 | 統計指標 |
|---|---|---|
| FCR(一次) | 残余需要の極短周期成分(サイクリック分) | 3σ相当値 + 単機最大容量の系統容量按分値 |
| S-FRR(二次①) | 残余需要の短周期成分(フリンジ分) | LFC信号の標準偏差 |
| FRR(二次②) | GC前後の時間内変動(サステンド分・短) | 30分コマ間差分の3σ |
| RR(三次①) | GC前後の時間内変動(サステンド分・長) | 連続コマの累積偏差 |
| RR-FiT(三次②) | FIT出力予測誤差 + 広域予備率 | 広域予備率閾値12%で追加調達発動 |
RR-FiTの追加調達は毎回発動するわけではない——広域予備率の予測が12%を下回る場合のみ、前日市場で追加調達が行われる。FY2024のデータでは、週間市場調達量の全エリア平均は4.9%、前日追加調達量の平均は4.2%であった。
FY2021〜FY2025:市場のゼロから全面稼働まで
需給調整市場の構築は段階的に進められた。2021年4月にRR-FiT(三次②)が先行開市し、その後市場は順次拡大した:
| 時期 | マイルストーン | 全国必要量(概算) |
|---|---|---|
| 2021年4月 | RR-FiT(三次②)開市 | 約1,500 MW/日 |
| 2022年4月 | FRR(二次②)・RR(三次①)開市 | 約3,200 MW/日 |
| 2023年4月 | S-FRR(二次①)開市 | 約4,800 MW/日 |
| 2024年4月 | FCR(一次)開市、5商品全面稼働 | 約7,200 MW/日 |
| 2025年度 | VRE浸透率上昇に伴い必要量が継続増加 | 約8,000 MW/日 |
下図はFY2021〜FY2025の商品別必要量の積み上げと、FY2026〜FY2030の予測トレンド(斜線部分)を示している:
出典:OCCTO委員会資料・METI資料・再生可能エネルギー研究所(2025)
調整力必要量 vs BESS 系統連系容量の対比
下図はFY2021〜FY2026の調整力必要量の増加とBESS系統連系容量の増加を対比したものであり、「市場需要が供給を大幅に上回る」構造的ギャップを視覚化している:
出所:OCCTO・EPRX・IEEFA(2026)・METI 公開資料より推計
2025年末時点で、日本の系統連系BESS容量は約620 MWに過ぎず、全国調整力必要量の約13,500 MW/日に対して圧倒的に不足している。IEEFAの予測では、LTDA長期契約のBESSプロジェクトが順次稼働するFY2026〜FY2028にかけて、系統連系BESS容量は1,200 MW超へ急増する見込みだが、それでも市場需要には遠く及ばない。
FY2024の市場動態:RR-FiT崩落、FCR台頭
FY2024は需給調整市場にとって最もドラマチックな年だった。4月のFCR開市後、市場参加者はすぐに裁定機会を発見した:
- RR-FiT(三次②):2024年4月の平均落札価格は234.89円/ΔkW・30分に達したが、BESSの大量参入により12か月で約63円まで下落——下落率73%超。
- FCR(一次):BESSが最も優位性を持つ商品として、4月のほぼゼロ成約から年末には平均落札価格が約88円/ΔkW・30分まで上昇し、新たな収益の柱となった。
- 全国不足率:FY2024の年間平均不足率は約28.5%。必要量の約3割が週間市場で適格な売り手を見つけられず、前日市場での追加調達や予備手段が必要となった。
この「RR-FiT崩落・FCR台頭」という構造変化は、日本のBESS投資家が深く理解すべき市場の本質的転換点だ。
FY2026:前日市場への全面移行
2026年度から、需給調整市場は重大な制度改革を迎える:全商品が週間市場から前日市場への取引に移行する。これが意味するのは:
- 調達頻度が週1回から毎日に変わり、BESS運営者はより頻繁に入札参加が必要となる。
- 価格発見メカニズムがよりリアルタイムになり、短期的な需給変化が落札価格に与える影響が大きくなる。
- 現物市場(JEPX)との協調裁定戦略がより複雑になり、より精緻な出力計画管理が求められる。
さらに、METIは需給調整市場と容量市場を統合した「同時市場」(Simultaneous Market)の長期構想を検討中であり、2030年代の実施が見込まれる。この改革はBESSの収益構造を根本的に変える可能性がある。
エリア別必要量の差異:なぜ九州は特別なのか?
調整力必要量はエリアによって大きく異なり、主にVRE浸透率と負荷規模を反映している:
| エリア | 特徴 | FCR必要量の特点 | BESS機会評価 |
|---|---|---|---|
| 九州 | 太陽光浸透率が全国最高、頻繁な出力制御 | 高く、季節変動大(春季最高) | ★★★★★ |
| 東京 | 最大負荷エリア、需要基盤が安定 | 高い(絶対量最大) | ★★★★☆ |
| 中部 | 産業負荷主体、VRE浸透率は中程度 | 中程度 | ★★★☆☆ |
| 関西 | 原発再稼働後にVRE調整需要が増加 | 中程度だが増加傾向が顕著 | ★★★★☆ |
| 北海道 | 風力比率が高いが連系線容量に制約 | 相対的に高い(孤立系統特性) | ★★★★☆ |
九州エリアの特殊性は特筆に値する。太陽光の装機密度が極めて高く(2025年春の最高瞬間浸透率は100%超)、九州電力は頻繁に出力制御を実施している。このため残余需要の変動性が他エリアより著しく高く、FCRおよびS-FRRの必要量が負荷規模に対して特に大きい。
9エリア別調整力必要量明細(FY2026推計、MW/日)
以下のヒートマップは、9つの電力エリアにおける5商品の必要量推計値(MW/日)を示す。データはOCCTO公開資料をもとに、エリア負荷シェアで按分推計したものである:
出所:OCCTO・EPRX 公開資料より負荷シェア按分推計
| エリア | 一次(FCR) | 二次①(S-FRR) | 二次②(FRR) | 三次①(RR-FiT) | 三次②(RR) | 合計 |
|---|---|---|---|---|---|---|
| 北海道 | 64 | 92 | 64 | 128 | 128 | 476 |
| 東北 | 144 | 207 | 144 | 288 | 288 | 1,071 |
| 東京 | 448 | 644 | 448 | 896 | 896 | 3,332 |
| 中部 | 224 | 322 | 224 | 448 | 448 | 1,666 |
| 北陸 | 48 | 69 | 48 | 96 | 96 | 357 |
| 関西 | 288 | 414 | 288 | 576 | 576 | 2,142 |
| 中国 | 112 | 161 | 112 | 224 | 224 | 833 |
| 四国 | 64 | 92 | 64 | 128 | 128 | 476 |
| 九州 | 208 | 299 | 208 | 416 | 416 | 1,547 |
| 全国合計 | 1,600 | 2,300 | 1,600 | 3,200 | 3,200 | 11,900 |
東京エリアの絶対量が最大(全国の約28%)だが、九州の「必要量/負荷比」が最も高く、極めて高いVRE浸透率を反映している。北陸・四国の絶対量は最小だが、連系線制約による孤立系統特性がBESSの限界価値を高めている。
BESS投資家への戦略的示唆
調整力必要量の算定ロジックを理解することは、BESS投資家に以下の直接的な示唆をもたらす:
| 次元 | 重要な洞察 | 戦略的提言 |
|---|---|---|
| 商品選択 | FCRの収益が最も安定しているが、5分以内の高速応答能力が必要 | FCR能力を優先的に確保し、システム設計で≤5秒応答を保証する |
| 立地選択 | 九州・北海道の必要量/負荷比が最高 | 九州・北海道の立地を優先検討するが、連系線制約を評価する |
| 容量仕様 | FRR(二次②)は継続放電能力が必要、RR-FiTは15分以上の応動が必要 | 2時間以上の蓄電時間で複数商品をカバーし、収益の多様化を図る |
| 市場タイミング | FY2026の前日市場移行で運営の複雑さが増す | 自動入札システムを事前に構築し、手動操作のタイムコストを回避する |
| 収益予測 | RR-FiT価格は大幅下落、FCRが新たな収益の柱に | 事業計画はFCR+現物裁定を主要収益源とし、RR-FiTを補完的に位置付ける |
まとめ:必要量の増加は構造的トレンド
FY2021の約1,500MWからFY2024の約7,200MWへ、需給調整市場の規模は3年間で約5倍に拡大した。この成長の根本的な原動力はVRE浸透率の持続的な上昇だ——太陽光・風力の出力変動性が高まるほど、電力系統が必要とする調整力は増大する。
METIの再生可能エネルギーロードマップによれば、日本は2030年までにVRE比率を36〜38%に引き上げる計画であり、調整力必要量は増加し続けるだろう。予測では、FY2030年には全国調整力必要量が11,000MW/日を超える可能性があり、FY2024水準の1.5倍以上となる。
BESS投資家にとって、これは単なる市場機会ではなく、構造的な長期トレンドだ。日本の電力システムが「化石燃料主導」から「VRE主導」へと転換する過程で、BESSが担う調整力の役割はますます不可欠なものとなっていく。
参考資料
Japan's Balancing Market Adjustment Power Requirements Explained: Five-Product Architecture, Historical Trends, and FY2030 Forecast
What Is the "Adjustment Power Requirement"?
The chōsei-ryoku hitsuyō-ryō (調整力必要量, "adjustment power requirement") is the core figure published periodically by Japan's Balancing Market (EPRX). According to the official EPRX FAQ, OCCTO publishes the full-year requirements table at fiscal year-end, then updates the following month's refined values at each month-end. It represents the capacity (in MW) that each grid area must procure to maintain supply-demand balance. This number directly determines the market opportunity size for flexible resources such as BESS, pumped hydro, and dispatchable thermal generation.
The requirement is calculated by OCCTO (Organization for Cross-regional Coordination of Transmission Operators) under a defined methodology, then published and procured by EPRX (the Electricity Power Exchange for balancing). The calculation is grounded in statistical analysis of residual demand—the load that remains after subtracting VRE (solar and wind) output, which must be served by dispatchable resources.
The Five-Product Architecture: Milliseconds to Hours
Japan's balancing market classifies adjustment power into five products by response speed, forming a complete frequency response chain:
| Product | Japanese Name | Response Time | Primary Function | BESS Suitability |
|---|---|---|---|---|
| FCR (Primary) | 一次調整力 | Within seconds | Immediate frequency stabilization (GF control) | ★★★★★ |
| S-FRR (Secondary ①) | 二次調整力① | Tens of seconds to minutes | LFC signal response, frequency restoration | ★★★★☆ |
| FRR (Secondary ②) | 二次調整力② | Several minutes | Short-cycle supply-demand balance post-GC | ★★★★☆ |
| RR (Tertiary ①) | 三次調整力① | Minutes to 15 minutes | Long-cycle supply-demand balance post-GC | ★★★☆☆ |
| RR-FiT (Tertiary ②) | 三次調整力② | Over 15 minutes | Wide-area grid adjustment, FIT output deviation correction | ★★★☆☆ |
FCR (Primary Regulation) is the product where BESS holds the strongest competitive advantage. The millisecond-level response speed required is unachievable by conventional thermal generators, while BESS can complete the transition from standby to full output in under 500 milliseconds.
Composite Products: An Important New Mechanism from FY2025
From FY2025, EPRX introduced a "composite product" (複合調整力) bidding mechanism, allowing flexible resources such as BESS to bundle FCR (primary), S-FRR (secondary ①), and FRR (secondary ②) into a single bid unit, with the system automatically allocating the actual output ratio across the three products. This offers three key advantages for BESS operators:
| Advantage | Explanation |
|---|---|
| Revenue maximization | The system dynamically allocates output across three products based on real-time demand, preventing idle capacity in any single product |
| Reduced bidding complexity | A single bid covers three products, reducing operational burden on system operators |
| Higher clearing probability | Composite product requirements are typically higher than individual products, spreading competition more broadly |
After the FY2026 transition to day-ahead trading, the composite product bidding window is adjusted to 12:00–14:00 the day before, with clearing results announced by 15:00. BESS developers should prioritize evaluating composite product applicability when planning system capacity—long-duration storage systems of 4 hours or more tend to outperform short-duration systems in composite product revenue.
How to Bid Composite Products
Composite product bidding uses a "primary product + secondary products (sub-quantity)" structure:
- Select the primary product: Choose the product with the largest biddable capacity as the primary product (e.g., Secondary ① / S-FRR)
- Bid secondary products at full volume: Other products are bid simultaneously as "sub-quantities" up to the primary product capacity. For example, a 100 MW BESS with S-FRR as primary can simultaneously bid 100 MW (sub-quantity) for FCR and RR
- System auto-allocation: The EPRX system automatically determines the optimal output allocation ratio based on real-time requirements for each product, minimizing total procurement costs for TSOs
Composite Product Clearing Mechanism (Asynchronicity Principle)
The theoretical basis of composite clearing is "asynchronicity"—the peak demand for each product does not occur simultaneously, allowing the same resource to provide different products at different times. The clearing price mechanism is as follows:
| Item | Description |
|---|---|
| Clearing Price | Based on the market clearing price of the primary product |
| Price Cap (Current) | ¥19.51/ΔkW/30 min (Primary through Secondary ① and composite products) |
| Price Cap (Post-FY2026 Reform) | ¥7.21/ΔkW/30 min (unified across all products, ~63% reduction) |
| Settlement Basis | Cleared Capacity (ΔkW) × Clearing Price × Number of Cleared Intervals |
Composite Product Dispatch Rules
After clearing composite products, BESS must provide balancing services according to EPRX real-time instructions:
- FCR (Primary): Automatic response triggered by frequency deviation, no central dispatch required, response time ≤30 seconds, duration ≥5 minutes
- S-FRR (Secondary ①): Complete output adjustment within 5 minutes of receiving LFC signal, duration ≥5 minutes
- RR (Tertiary ①): Complete output adjustment within 15 minutes of receiving EDC signal, duration ≥30 minutes
- Priority Order: When simultaneous signals are received for multiple products, execution follows FCR > S-FRR > RR priority, with the system ensuring rated capacity is not exceeded
Composite vs. Single Product: Revenue Comparison
The chart below compares annual expected revenue for a 100 MW BESS under composite vs. single-product bidding strategies (based on FY2024 market data):
How the Requirement Is Calculated
OCCTO's calculation formula uses "residual demand raw data" as its basis, computing each product's requirement separately:
| Product | Calculation Basis | Statistical Metric |
|---|---|---|
| FCR (Primary) | Ultra-short-cycle component of residual demand (Cyclic) | 3σ value + largest single-unit capacity weighted by system share |
| S-FRR (Secondary ①) | Short-cycle component of residual demand (Fringe) | Standard deviation of LFC signals |
| FRR (Secondary ②) | Intra-period variation post-GC (Sustained, short) | 3σ of 30-minute interval differences |
| RR (Tertiary ①) | Intra-period variation post-GC (Sustained, long) | Cumulative deviation across consecutive intervals |
| RR-FiT (Tertiary ②) | FIT output forecast error + wide-area reserve margin | Additional procurement triggered when wide-area reserve falls below 12% |
Notably, RR-FiT additional procurement does not trigger every time—it only activates in the day-ahead market when the wide-area reserve margin forecast falls below 12%. FY2024 data shows that the national average weekly market procurement was 4.9%, while day-ahead additional procurement averaged 4.2%.
FY2021–FY2025: From Zero to Full Operation
Japan's balancing market was built in phases. RR-FiT (Tertiary ②) launched first in April 2021, and the market expanded progressively:
| Date | Milestone | National Requirement (est.) |
|---|---|---|
| April 2021 | RR-FiT (Tertiary ②) launched | ~1,500 MW/day |
| April 2022 | FRR (Secondary ②) and RR (Tertiary ①) launched | ~3,200 MW/day |
| April 2023 | S-FRR (Secondary ①) launched | ~4,800 MW/day |
| April 2024 | FCR (Primary) launched — all five products fully operational | ~7,200 MW/day |
| FY2025 | Continued growth driven by rising VRE penetration | ~8,000 MW/day |
The chart below shows the stacked requirements by product from FY2021 to FY2025, along with projected trends through FY2030 (hatched bars):
Sources: OCCTO Committee Documents, METI Reports, Renewable Energy Institute (2025)
Adjustment Power Requirements vs. BESS Grid-Connected Capacity
The chart below contrasts the growth in total adjustment power requirements with the growth in BESS grid-connected capacity from FY2021 to FY2026, visualizing the structural gap where market demand far exceeds supply:
Source: Estimated from OCCTO/EPRX/IEEFA (2026)/METI public data
As of end-2025, Japan's grid-connected BESS capacity stands at approximately 620 MW — a fraction of the ~13,500 MW/day national adjustment power requirement. Even accounting for BESS participating in multiple products simultaneously, the supply-demand gap remains enormous. IEEFA projects that grid-connected BESS capacity will grow rapidly to over 1,200 MW by FY2026–FY2028 as LTDA long-term contract projects come online, but this still falls far short of market demand.
FY2024 Market Dynamics: RR-FiT Collapse, FCR Rise
FY2024 was the most dramatic year in the balancing market's history. After FCR launched in April, market participants quickly identified arbitrage opportunities:
- RR-FiT (Tertiary ②): The average clearing price in April 2024 reached ¥234.89/ΔkW per 30 minutes. As BESS capacity flooded the market, prices fell to approximately ¥63 within 12 months—a decline of over 73%.
- FCR (Primary): As the product where BESS holds the strongest advantage, FCR grew from near-zero transactions in April to an average clearing price of approximately ¥88/ΔkW per 30 minutes by year-end, becoming the new revenue pillar.
- National Shortage Rate: The FY2024 annual average shortage rate was approximately 28.5%, meaning roughly 30% of the required capacity could not find qualified sellers in the weekly market, necessitating day-ahead additional procurement or fallback measures.
This structural shift—"RR-FiT collapse, FCR rise"—represents a fundamental market transition that Japan's BESS investors must deeply understand.
FY2026: Full Transition to Day-Ahead Market
From FY2026, the balancing market will undergo a major institutional reform: all products will transition from weekly to day-ahead market trading. This means:
- Procurement frequency changes from weekly to daily, requiring BESS operators to participate in bidding more frequently.
- Price discovery becomes more real-time, with short-term supply-demand changes having a greater impact on clearing prices.
- Coordinated arbitrage strategies with the spot market (JEPX) become more complex, requiring more sophisticated output scheduling.
Additionally, METI is exploring a long-term plan to integrate the balancing market and capacity market into a "Simultaneous Market," expected to be implemented in the 2030s. This reform could fundamentally reshape BESS revenue structures.
Regional Variation: Why Is Kyushu Special?
Adjustment power requirements vary significantly across grid areas, primarily reflecting VRE penetration rates and load scale:
| Area | Characteristics | FCR Requirement Profile | BESS Opportunity |
|---|---|---|---|
| Kyushu | Highest solar penetration nationally, frequent curtailment | High, with large seasonal variation (spring peak) | ★★★★★ |
| Tokyo | Largest load area, stable demand base | High (largest absolute volume) | ★★★★☆ |
| Chubu | Industrial load dominant, moderate VRE penetration | Moderate | ★★★☆☆ |
| Kansai | VRE adjustment demand increasing after nuclear restarts | Moderate but with clear upward trend | ★★★★☆ |
| Hokkaido | High wind ratio but constrained interconnection capacity | Relatively high (isolated system characteristics) | ★★★★☆ |
Kyushu's special status deserves particular attention. With extremely high solar installation density (peak instantaneous penetration exceeding 100% in spring 2025), Kyushu Electric Power frequently implements curtailment. This causes residual demand volatility far exceeding other areas, making FCR and S-FRR requirements particularly high relative to load scale.
Nine-Area Adjustment Power Requirements Breakdown (FY2026 Estimates, MW/day)
The heatmap below shows estimated daily requirements (MW/day) across nine power areas and five product categories, calculated from OCCTO public data proportional to each area's load share:
Source: Estimated from OCCTO/EPRX public data proportional to area load share
| Area | Primary (FCR) | Secondary ① (S-FRR) | Secondary ② (FRR) | Tertiary ① (RR-FiT) | Tertiary ② (RR) | Total |
|---|---|---|---|---|---|---|
| Hokkaido | 64 | 92 | 64 | 128 | 128 | 476 |
| Tohoku | 144 | 207 | 144 | 288 | 288 | 1,071 |
| Tokyo | 448 | 644 | 448 | 896 | 896 | 3,332 |
| Chubu | 224 | 322 | 224 | 448 | 448 | 1,666 |
| Hokuriku | 48 | 69 | 48 | 96 | 96 | 357 |
| Kansai | 288 | 414 | 288 | 576 | 576 | 2,142 |
| Chugoku | 112 | 161 | 112 | 224 | 224 | 833 |
| Shikoku | 64 | 92 | 64 | 128 | 128 | 476 |
| Kyushu | 208 | 299 | 208 | 416 | 416 | 1,547 |
| National Total | 1,600 | 2,300 | 1,600 | 3,200 | 3,200 | 11,900 |
Tokyo has the largest absolute volume (~28% of national total), but Kyushu has the highest "requirements-to-load ratio," reflecting its exceptionally high VRE penetration. Hokuriku and Shikoku have the smallest absolute volumes, but their isolated grid characteristics (limited interconnector capacity) increase the marginal value of BESS.
Strategic Implications for BESS Investors
Understanding the calculation logic behind adjustment power requirements provides BESS investors with the following direct insights:
| Dimension | Key Insight | Strategic Recommendation |
|---|---|---|
| Product Selection | FCR offers the most stable revenue, but requires sub-5-second response capability | Prioritize FCR capability; system design must guarantee ≤5-second response |
| Location Selection | Kyushu and Hokkaido have the highest requirement-to-load ratios | Prioritize Kyushu and Hokkaido siting, but assess interconnection constraints |
| Capacity Specification | FRR (Secondary ②) requires sustained discharge; RR-FiT needs 15+ minute response | 2+ hour storage duration covers more products and diversifies revenue |
| Market Timing | FY2026 day-ahead transition increases operational complexity | Build automated bidding systems in advance to avoid manual scheduling costs |
| Revenue Forecasting | RR-FiT prices have fallen sharply; FCR is now the primary revenue driver | Business plans should treat FCR + spot arbitrage as primary revenue, with RR-FiT as supplementary |
Conclusion: Rising Requirements Are a Structural Trend
From approximately 1,500 MW in FY2021 to approximately 7,200 MW in FY2024, Japan's balancing market has grown nearly fivefold in three years. The fundamental driver of this trend is the sustained rise in VRE penetration—the higher the output variability of solar and wind, the more adjustment power the grid requires.
According to METI's renewable energy roadmap, Japan plans to raise VRE's share to 36–38% by 2030, meaning adjustment power requirements will continue to grow. Projections suggest that by FY2030, the national adjustment power requirement could exceed 11,000 MW/day—more than 1.5 times the FY2024 level.
For BESS investors, this represents not merely a market opportunity but a structural long-term trend. As Japan's power system transitions from "fossil fuel-dominated" to "VRE-dominated," the role of BESS in providing adjustment power will become increasingly indispensable.
References
- EPRX. "Adjustment Power Requirements Table." Electricity Power Exchange for Balancing.
- OCCTO. "112th Committee on Adjustment Power and Supply-Demand Balance Assessment." 2024.
- Renewable Energy Institute. "Current Status and Challenges of Grid-Scale Battery Storage in Japan." April 2025.
- METI. "Current Status and Challenges of the Balancing Market." Advisory Committee on Basic Energy Policy, 2024.