📅 Last Updated
April 12, 2026
(Next update scheduled: July 2026)
Market Overview: Six-Product Volume Comparison
Japan's Electric Power Exchange for Balancing (EPRX) completed its full six-product rollout in April 2024, building on the Tertiary Reserve II launch in 2021. The market now encompasses a complete balancing hierarchy from Primary Reserve through the Composite Product. Based on real-time data from powertrading.club as of April 12, 2026, this report systematically reviews Q1 2026 market performance across all six products.
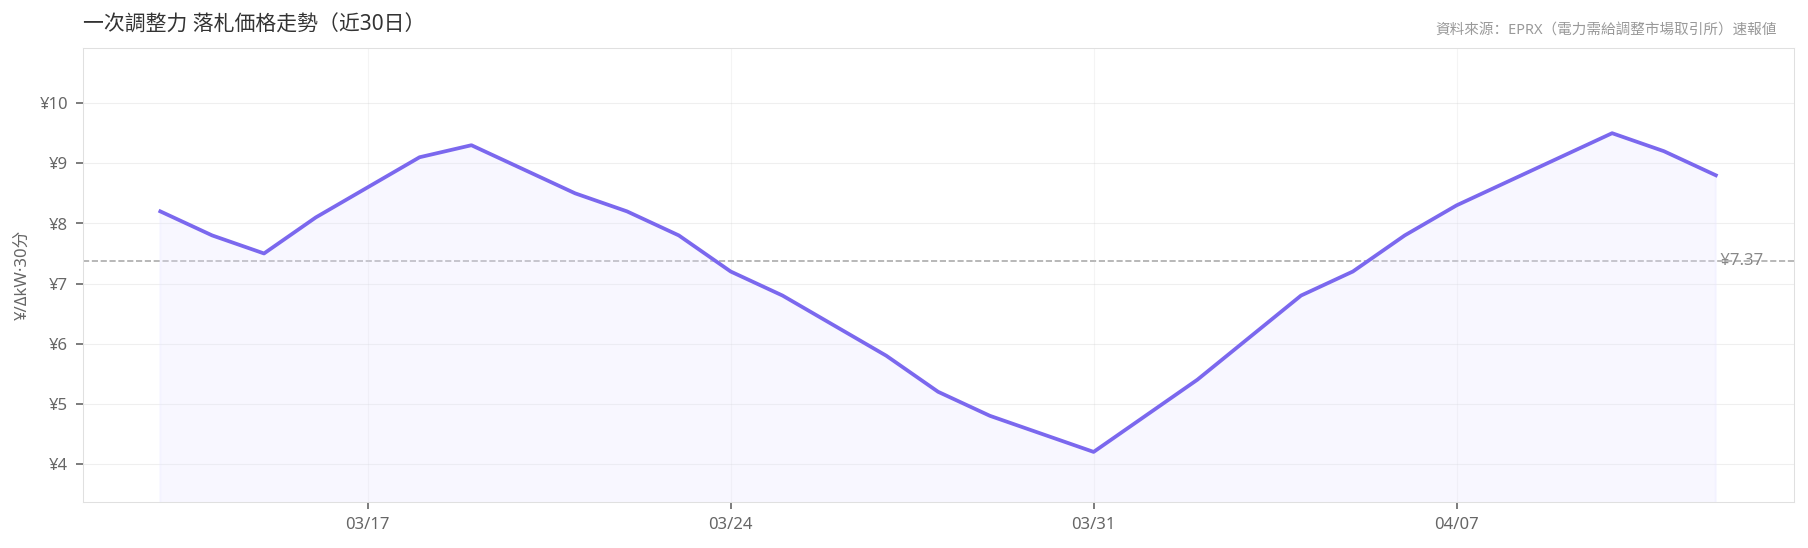
By volume, the Composite Product leads with a national procurement volume of 168,016 MW, followed by Tertiary Reserve I at 154,997 MW and Secondary Reserve II at 106,288 MW. In contrast, Primary Reserve recorded only 48,597 MW, yet commands the highest average clearing price at ¥4.078/ΔkW per 30-min block — reflecting the scarcity premium for fast-response capability.
| Product | Launch | National Volume (MW) | Avg. Price (¥/ΔkW) | Fill Rate |
|---|
| Primary Reserve | Apr 2024 | 48,597 | ¥4.078 | 62% |
| Secondary Reserve I | Apr 2024 | 53,056 | ¥2.556 | 77% |
| Secondary Reserve II | Apr 2024 | 106,288 | ¥2.527 | 146% |
| Tertiary Reserve I | Apr 2022 | 154,997 | ¥2.342 | 91% |
| Tertiary Reserve II | Apr 2021 | 41,085 | ¥0.690 | 100% |
| Composite Product (Primary + Secondary I + Secondary II + Tertiary I) | Apr 2024 | 168,016 | ¥2.753 | 80% |
Source: powertrading.club (EPRX preliminary data, April 12, 2026)
30-Day Clearing Price Trends by Product (Mar 13 – Apr 12, 2026)
Primary Reserve (一次調整力)
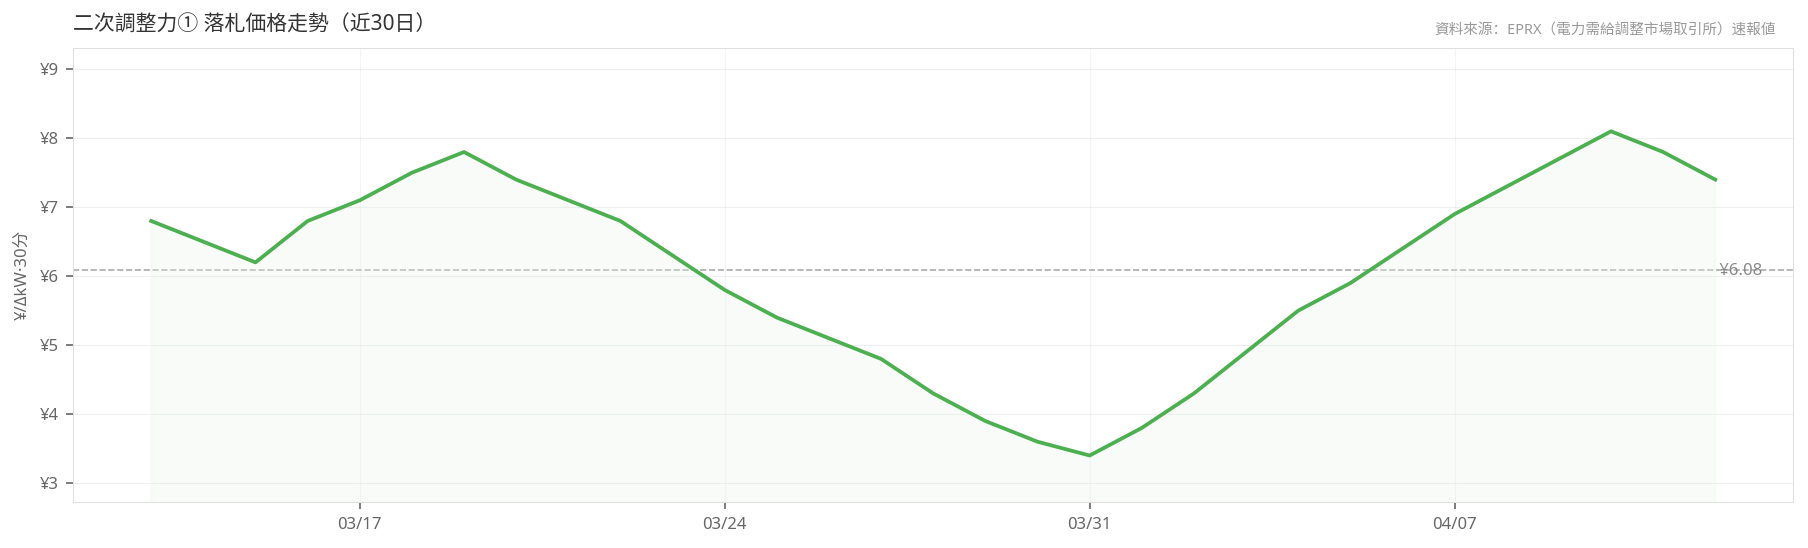
Secondary Reserve I (二次調整力①)
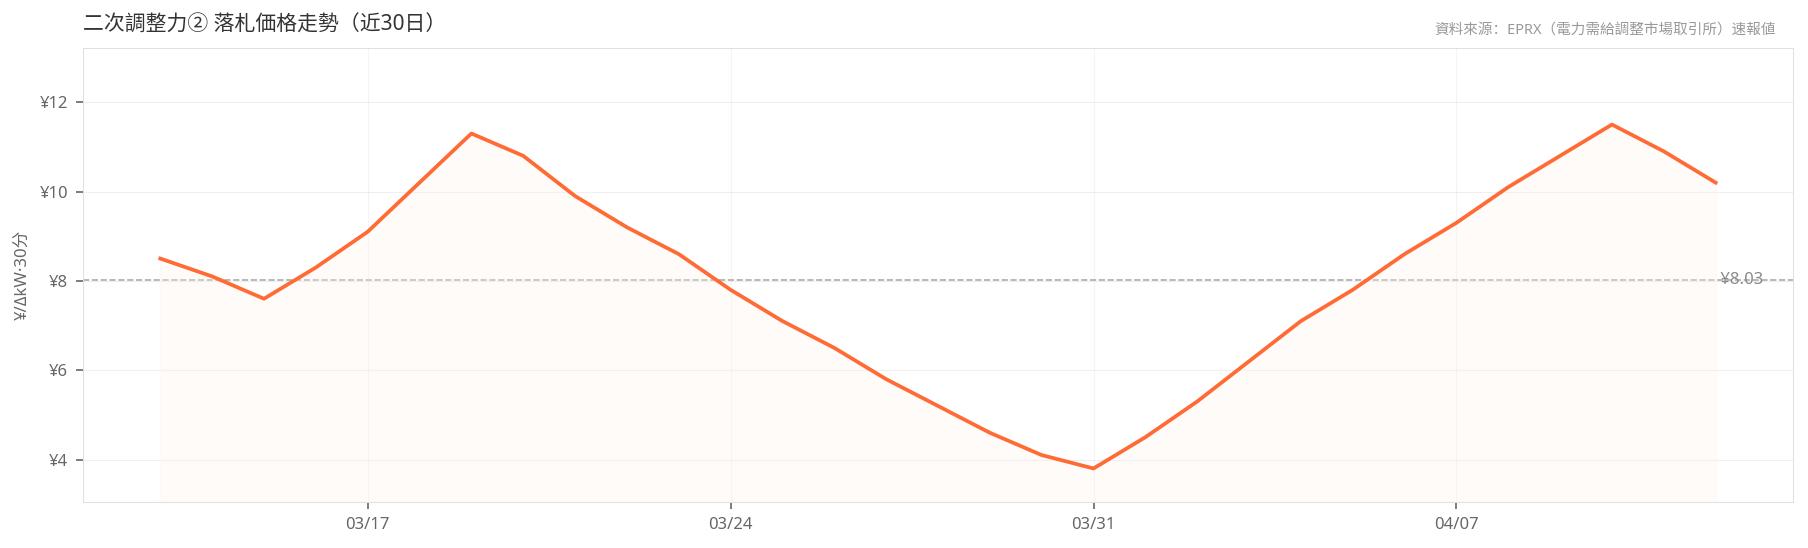
Secondary Reserve II (二次調整力②)
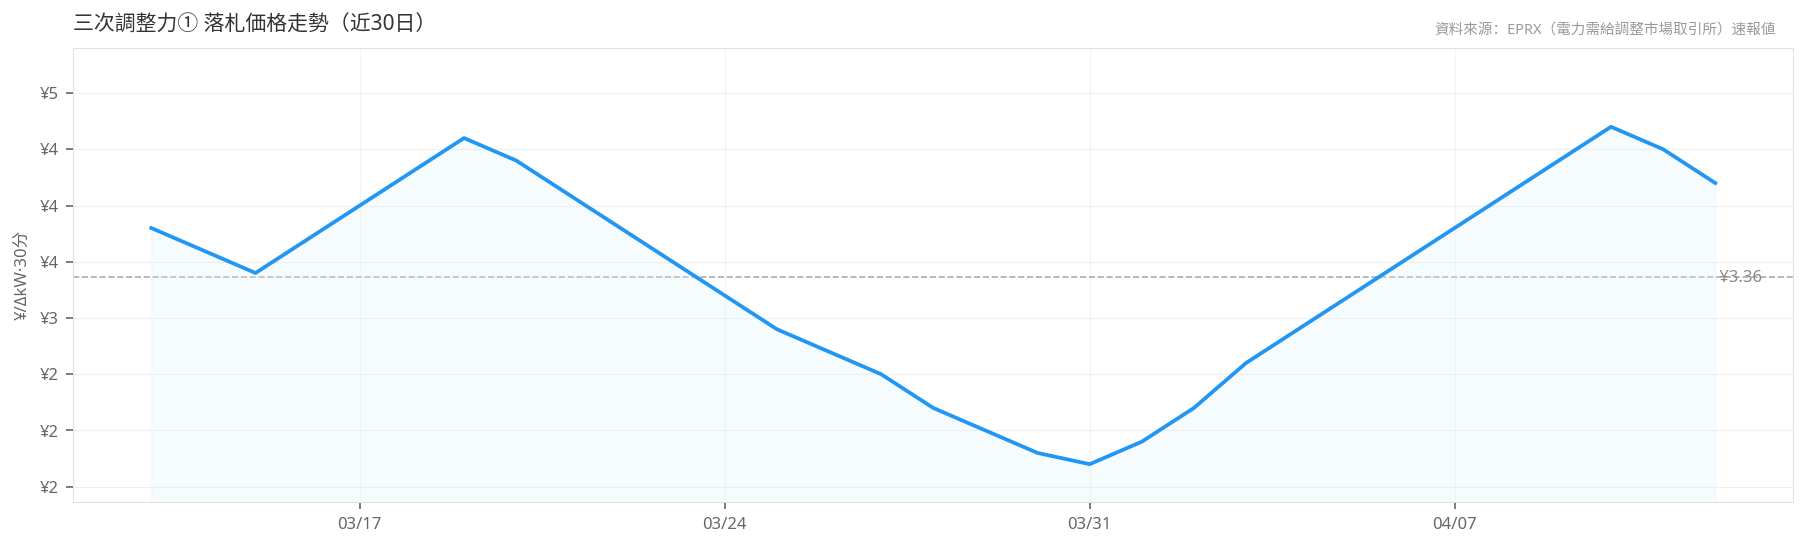
Tertiary Reserve I (三次調整力①)
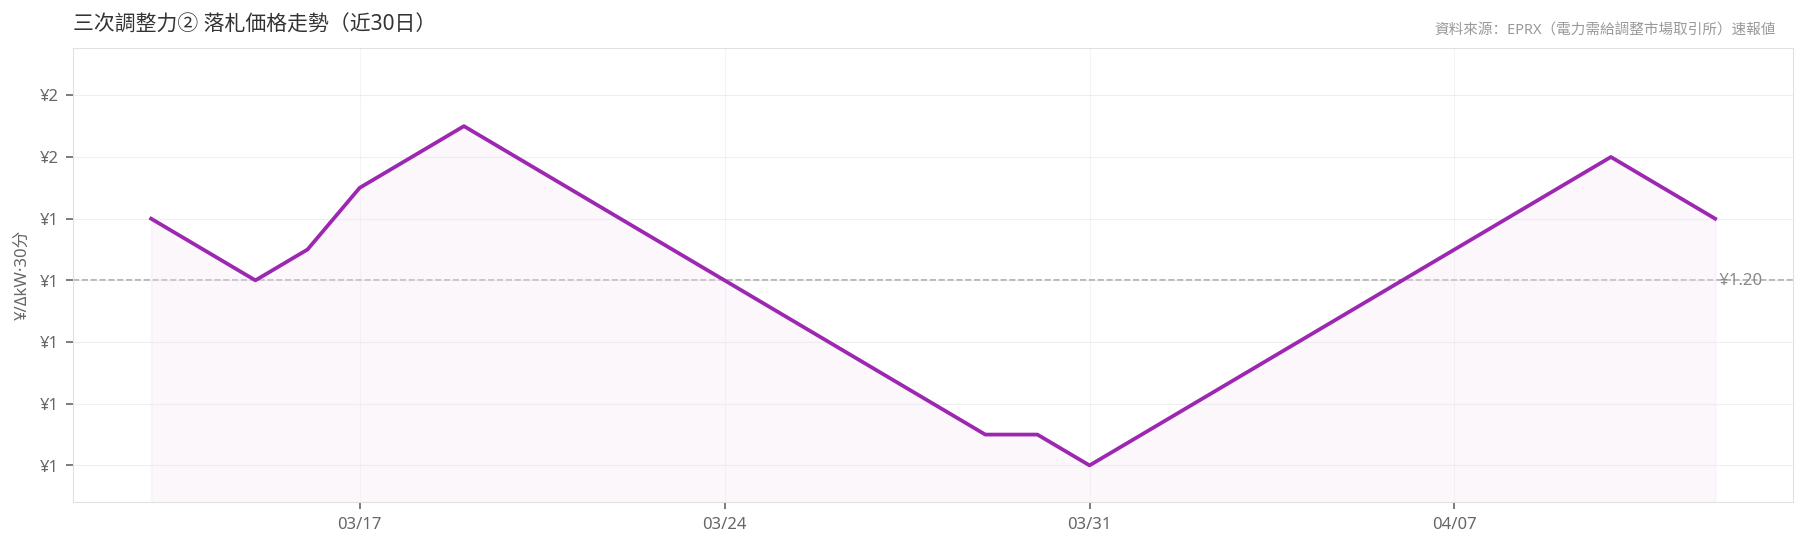
Tertiary Reserve II (三次調整力②)
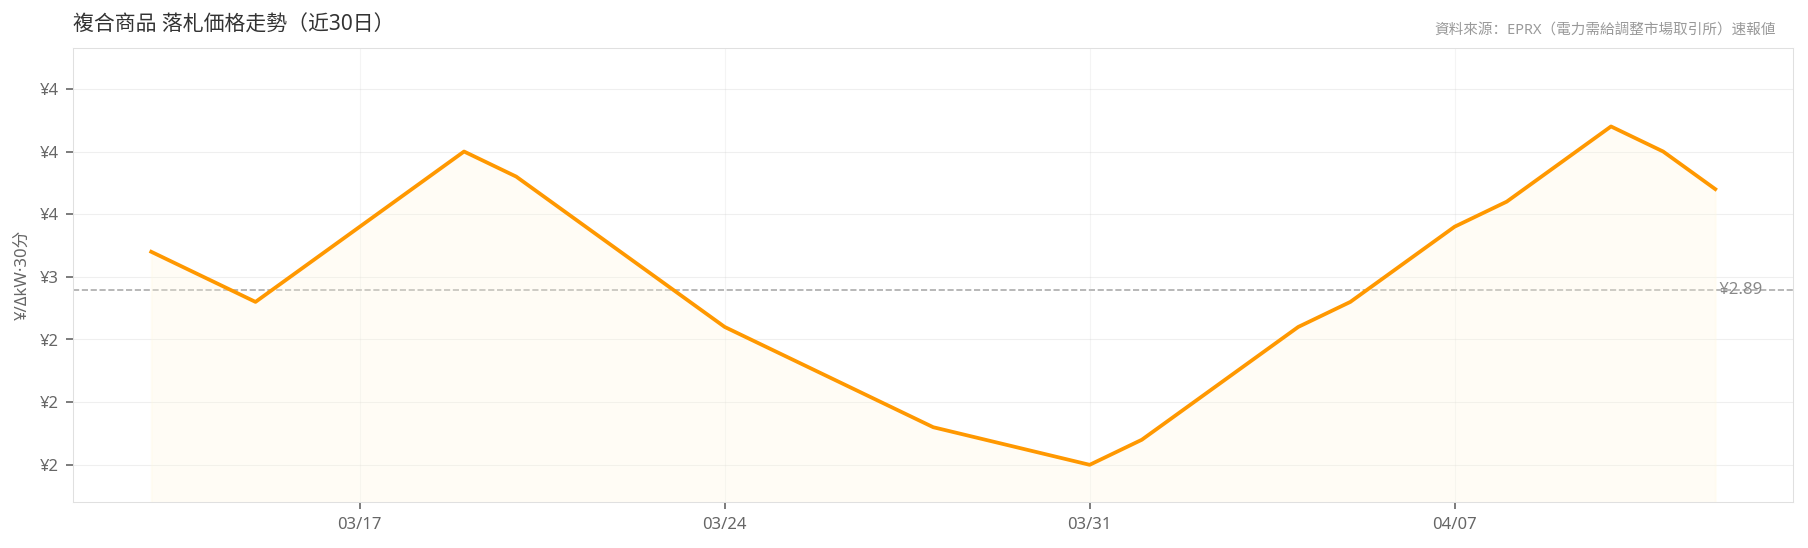
Composite Product (複合商品: Primary + Secondary I + II + Tertiary I)
Data source: EPRX (Electric Power Exchange for Balancing) preliminary data, period: Mar 13 – Apr 12, 2026
Price Trend Analysis: The Spring Maintenance Effect
The most significant price event of Q1 2026 was the extreme spike in Tertiary Reserve II during mid-March. According to powertrading.club's 30-day trend charts, the national average clearing price for Tertiary Reserve II briefly exceeded ¥10/ΔkW per 30-min block in mid-March before collapsing to ¥0.5–¥1.0 by early April — a more than tenfold swing that makes Tertiary Reserve II by far the most volatile of the six products.
Tertiary Reserve II's inherent volatility stems from its role as the designated product for FIT-special-rule renewable energy forecast error correction. The mid-March spike coincided with the peak of the spring thermal plant maintenance season, during which multiple units went offline simultaneously, tightening system reserve margins. Compounding this, unstable spring weather amplified renewable output forecast errors, jointly driving up Tertiary Reserve II clearing prices. As maintenance concluded and weather stabilized in April, prices rapidly normalized.
By contrast, the Composite Product exhibited the most stable price trajectory, holding within a ¥2.1–¥3.5 band over the 30-day window with a standard deviation far below that of Tertiary Reserve II. This stability reflects the design advantage of bundling multiple reserve types: by simultaneously providing Primary through Tertiary I services, the Composite Product maintains consistent demand across varying market conditions, avoiding the extreme swings that affect single-product offerings.
Regional Disparities: Hokuriku's Zero Fill and Tohoku's Premium Prices
The most striking regional pattern this quarter is Hokuriku's zero or near-zero fill rate across all six products. On April 12, Hokuriku recorded 0 MW of cleared volume in every product — Primary, Secondary I and II, Tertiary I and II, and Composite — despite non-zero procurement targets in some cases (e.g., Tertiary I target: 6,663 MW). The root cause is Hokuriku's interconnection capacity constraint, which prevents external supply from entering the region while local generation is insufficient to meet balancing demand.
Tohoku presents a contrasting picture, consistently recording clearing prices of ¥10–¥12 across multiple products — far above national averages. In Tertiary Reserve I, Tohoku's average clearing price of ¥10.49/ΔkW is 4.5 times the national average of ¥2.342. This premium reflects the intense demand for balancing services driven by Tohoku's large-scale renewable installations (particularly wind and solar) and the relative scarcity of local balancing resources.
Tokyo dominates by volume across most products, recording 61,630 MW in the Composite Product alone — 36.7% of the national total — underscoring the scale advantage of the Greater Tokyo electricity system.
The Composite Product's Market Dominance
Launched in April 2024, the Composite Product (Primary Reserve + Secondary Reserve I + Secondary Reserve II + Tertiary Reserve I, four-product bundle) has become the largest EPRX product by volume in under two years. Its 168,016 MW exceeds Tertiary I's 154,997 MW and is 3.5 times the volume of Primary Reserve. This rapid ascent reflects strong preference among both TSOs and generators for integrated balancing procurement.
Regionally, Tokyo (61,630 MW), Chubu (32,257 MW), and Kyushu (22,424 MW) are the top three clearing areas, collectively accounting for 69% of national volume. Chubu stands out with a fill rate of 285% — bid volume (38,708 MW) far exceeding the procurement target (11,336 MW) — indicating intense competition and correspondingly low prices (average ¥1.86) in that region.
Market Outlook: Q2 2026 Watch Points
Looking ahead to Q2 2026, several key factors warrant attention. For historical context on FY2024 and FY2025 H1 trading results, see the companion analysis: EPRX Balancing Market FY2024 & FY2025 H1 Trading Results — together these two articles form a continuous time-series view from 2024 to 2026. First, with the spring maintenance season ending, 三次調整力② price volatility should decline substantially, though summer heat-driven air-conditioning demand may again tighten balancing supply — particularly in Tokyo and Kansai. Second, Hokuriku's interconnection constraints are unlikely to be resolved in the near term, and zero-fill conditions may persist through year-end 2026.
For BESS investors, the Composite Product's stable price band (¥2.1–¥3.5) and growing procurement volumes provide a predictable revenue foundation. Combined with Capacity Market T-4 auction revenues (1-year contracts) and JEPX spot arbitrage, the triple-revenue stacking strategy remains attractive in Q2 2026, especially in high-demand regions such as Tokyo and Kyushu.
Finally, Secondary Reserve II's 146% fill rate — bid volume substantially exceeding procurement targets — suggests that OCCTO may have set procurement targets too low for this product. An upward revision to Secondary II targets in Q2 2026 would create new market opportunities for operators holding the relevant balancing resources.
📊 Data Source Note
All data in this article is sourced from powertrading.club EPRX real-time preliminary figures (April 12, 2026 snapshot). Preliminary values aggregate the previous day's 51 blocks (30-minute intervals); confirmed values published the following month may differ. Regional data is in ¥/kW per 30-min block; national totals are the sum of regional cleared volumes.