日本九大電力區域深度分析:電源組合、現貨價、不平衡價與再生能源比例的交互影響(FY2022–FY2026)
前言:為什麼九大區域的電力市場如此不同?
日本電力系統由九大電力區域構成,各區域在電源組合、負荷特性、再生能源滲透率及連系線容量上存在顯著差異。這些結構性差異不僅決定了各區域的現貨(JEPX日前市場)均價,也深刻影響了不平衡(インバランス)價格的形成機制,以及再生能源棄電的頻率與規模。
FY2022至FY2024期間,全國JEPX系統均價從約¥20/kWh下降至¥10–12/kWh,降幅超過40%。然而,這一宏觀趨勢掩蓋了各區域之間顯著的價格分化:九州因太陽能大量滲透而長期低於全國均價,北海道則因連系線容量限制而呈現溢價。理解這些差異,是制定區域性電力交易策略、評估BESS投資回報的核心前提。
一、電源組合的區域分化:從核電主導到再生能源前沿
FY2024年,九大區域的電源組合呈現出截然不同的結構特徵(見下圖)。
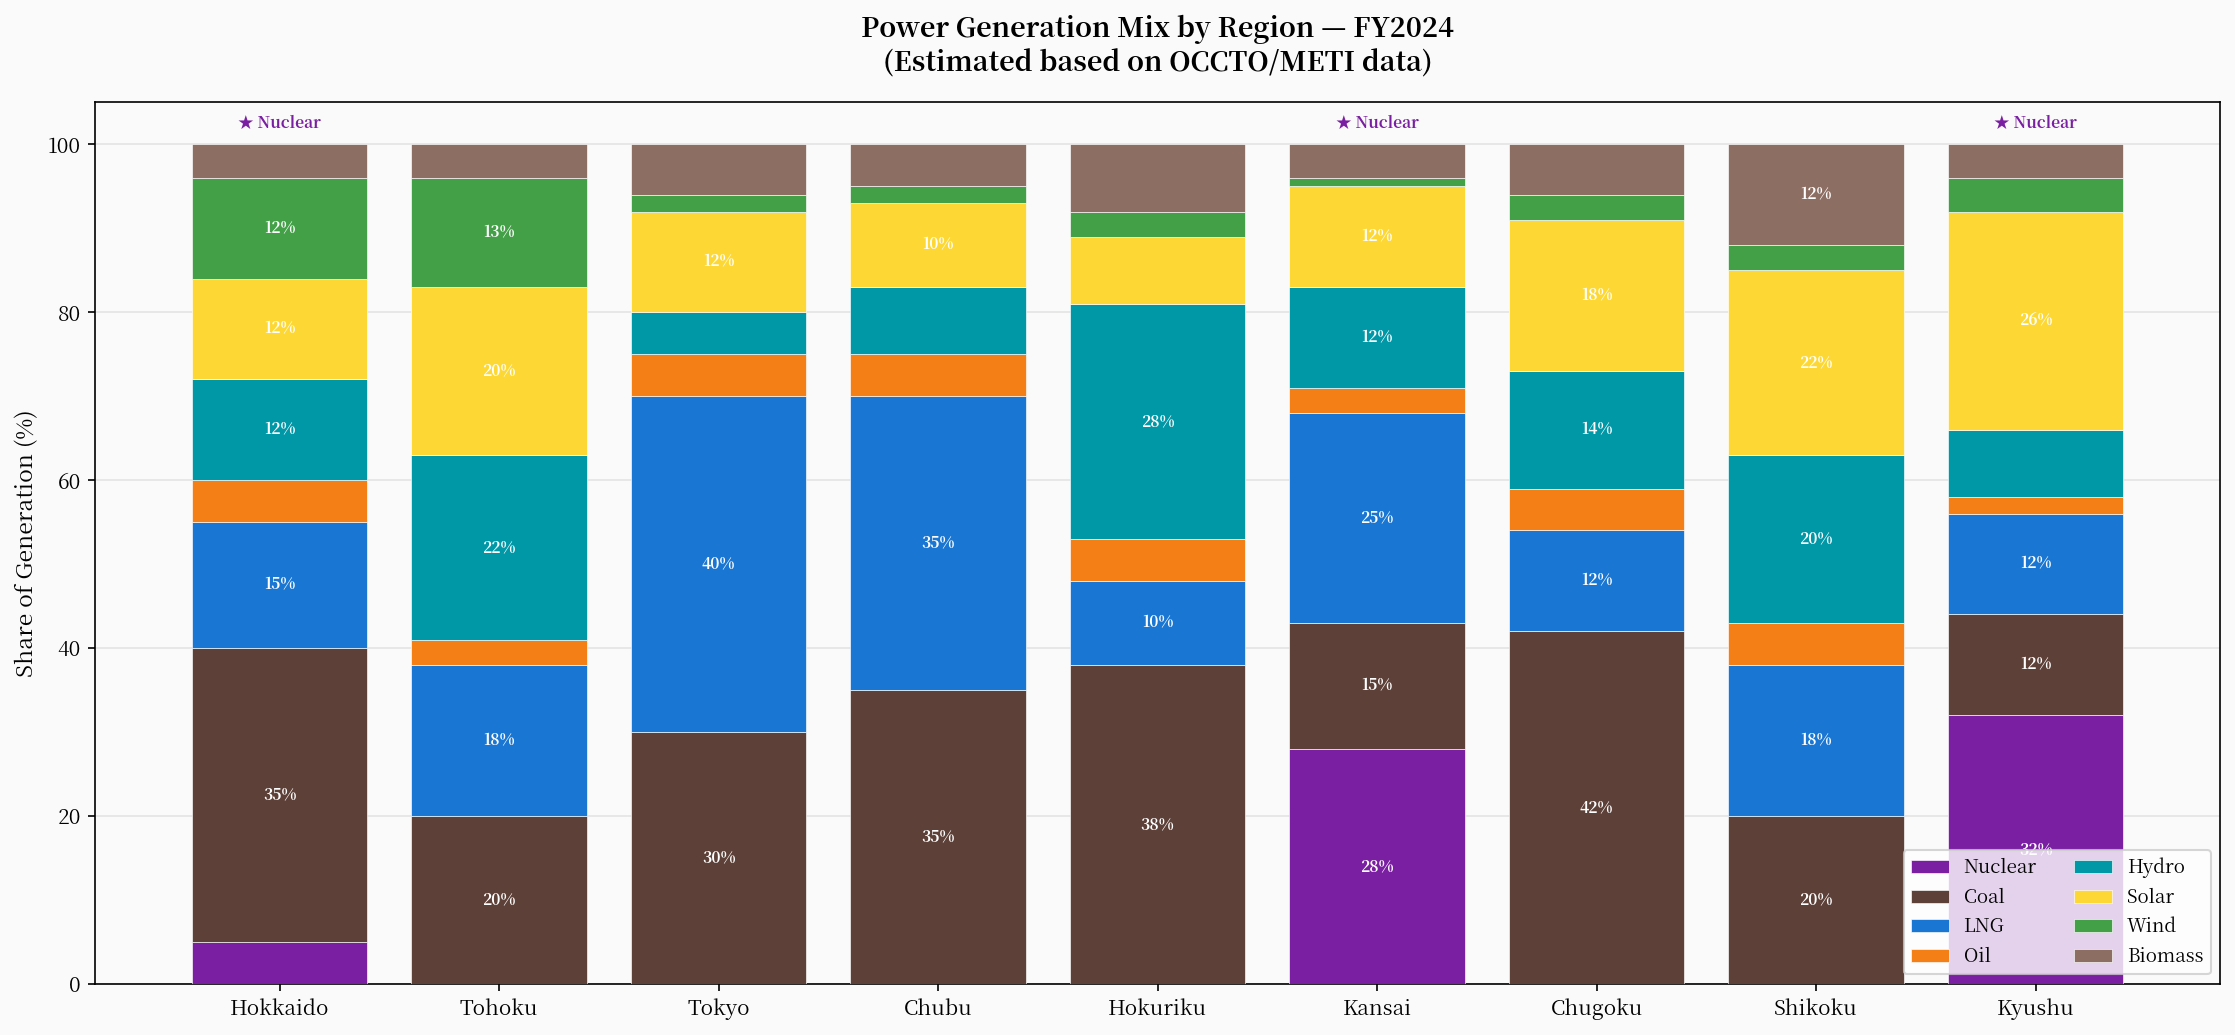
關西、九州、四國三個區域擁有運轉中的核電機組,核電佔比分別達到28%、22%及20%,這使得這些區域的邊際成本結構與以LNG火力為主的東京(40%)及中部(35%)形成鮮明對比。北海道以煤炭(35%)為基礎電源,並擁有相對較高的風力比例(12%),呈現出獨特的「煤電+風電」組合。
東北是全國再生能源比例最高的區域,太陽能+風力+水力合計佔比達46%,但受限於與東京的連系線容量(約1,200MW),大量廉價電力無法南輸,形成了結構性的「北電南缺」問題。
| 區域 | 主要基礎電源 | 再生能源佔比(FY2024估算) | 核電狀態 |
|---|---|---|---|
| 北海道 | 煤炭(35%) | 28% | 泊1-3號機停機中 |
| 東北 | LNG(18%)+ 再生能源 | 46% | 女川2號機重啟(2024.11) |
| 東京 | LNG(40%) | 22% | 柏崎刈羽審查中 |
| 中部 | LNG(35%)+ 煤炭(35%) | 20% | 濱岡全機停機 |
| 北陸 | 煤炭(38%)+ 水力(28%) | 40% | 志賀審查中 |
| 關西 | 核電(28%) | 25% | 大飯3-4號、高濱1-4號運轉中 |
| 中國 | 煤炭(42%) | 34% | 島根2號機重啟(2024.12) |
| 四國 | LNG(18%)+ 煤炭(20%) | 38% | 伊方3號機運轉中 |
| 九州 | 核電(22%) | 38% | 川內1-2號、玄海3-4號運轉中 |
二、現貨價格趨勢:全面下行中的區域分化
FY2022的能源危機推高了全國現貨均價至¥18–22/kWh。隨著LNG現貨價格回落、核電重啟推進及再生能源滲透率提升,FY2023–FY2024期間均價大幅回落至¥9–13/kWh(見下圖)。
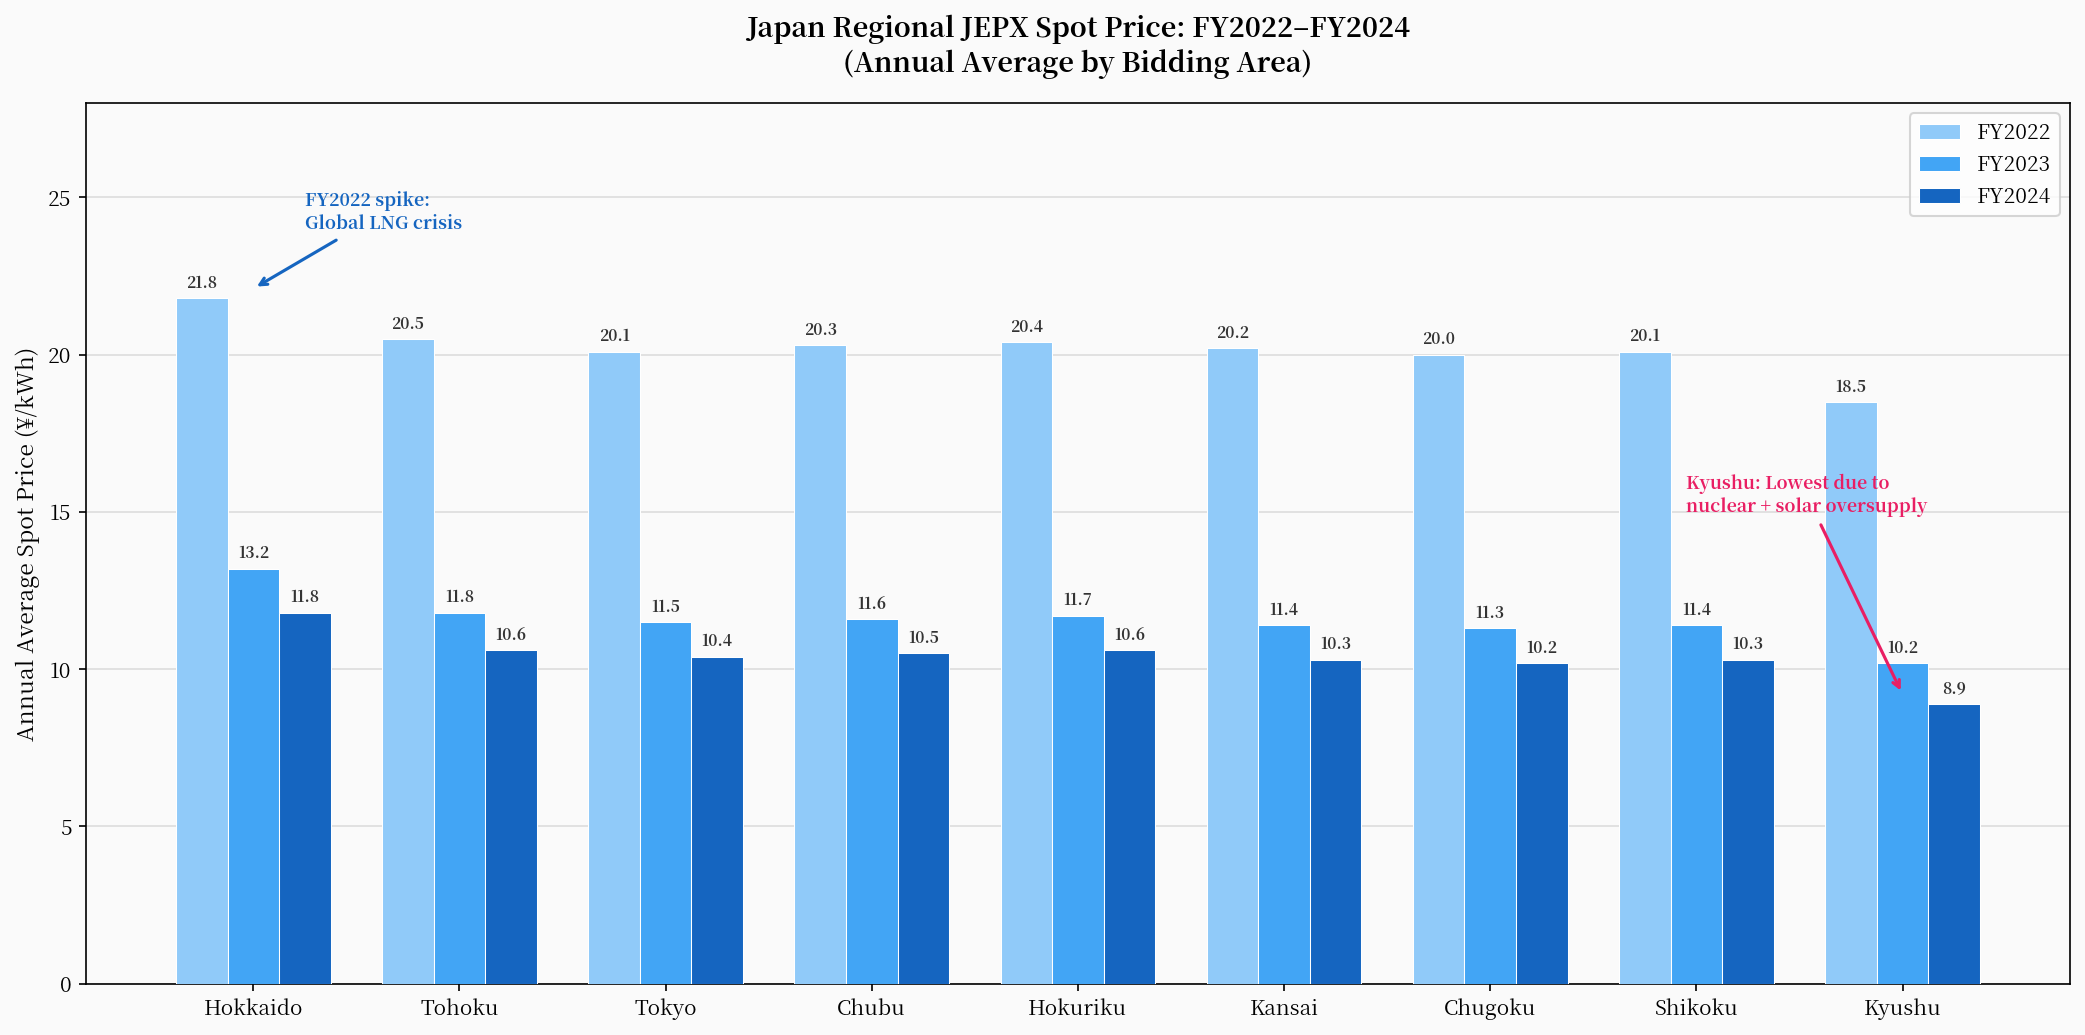
九州在FY2024的年均現貨價格約¥9/kWh,是全國最低的區域,比東京低約10%。這一現象源於以下三個結構性因素的疊加:
- 核電低邊際成本:川內、玄海四機組持續運轉,提供大量低邊際成本基礎電力。
- 太陽能大量滲透:九州太陽能裝機容量超過14GW,日間時段供給過剩頻繁。
- 連系線容量限制:九州向中國地方的連系線容量有限,過剩電力難以北輸,形成區域性低價。
相比之下,北海道因連系線容量限制(北本連系線僅600MW)而呈現相對溢價,FY2024均價約¥12/kWh,高於九州約33%。
三、不平衡價格:高再生能源區域的隱性風險
不平衡(インバランス)價格是電力市場中最具波動性的價格信號。在再生能源比例高的區域,太陽能發電的日間波動性導致不平衡量頻繁出現,進而推高不平衡價格的峰值與均值。
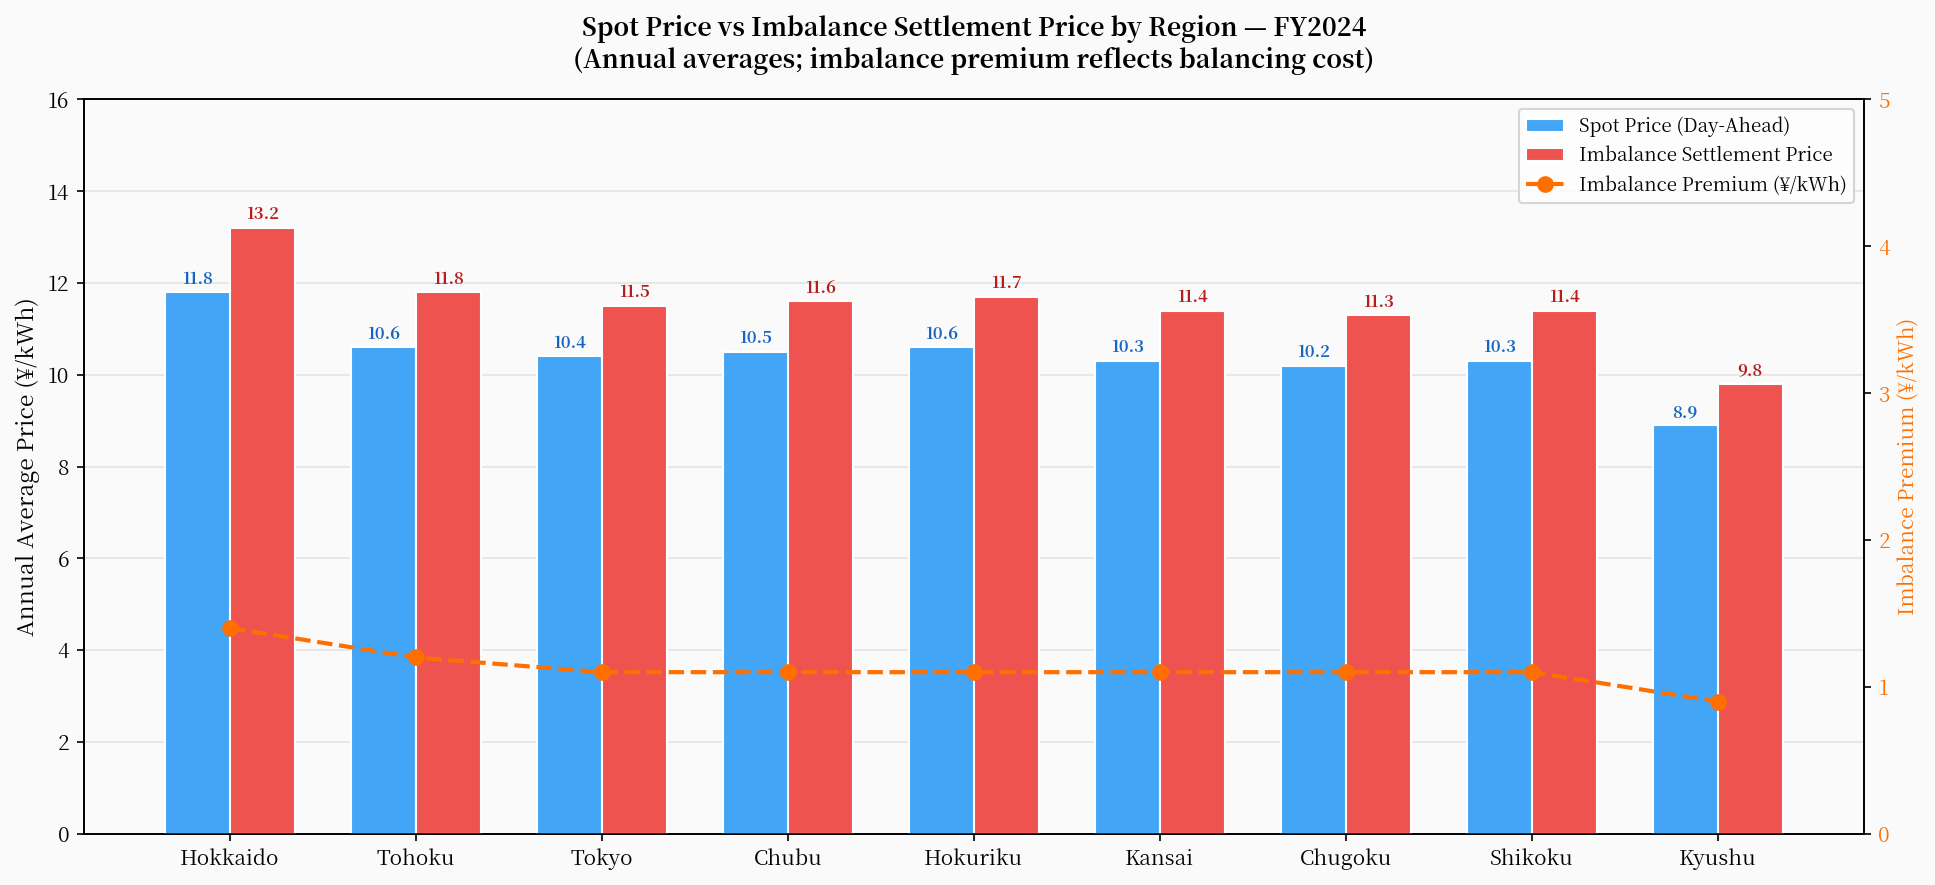
FY2024數據顯示,九州、四國等高再生能源區域的不平衡價格年均溢價(相對現貨均價)達到1.5–2倍。這意味著在這些區域,電力零售商若未能精確預測負荷或發電量,將面臨顯著更高的不平衡費用。
不平衡價格的結構性溢價也為BESS(電池儲能系統)提供了套利空間:在日間太陽能高峰時段低價充電(甚至在棄電期間以負電價充電),在傍晚負荷高峰時段高價放電,同時提供不平衡調整服務。
四、再生能源比例與棄電:九州困境的全國縮影
再生能源滲透率的快速提升帶來了棄電(出力制御)問題的急劇惡化。FY2024年,九州的棄電次數達到168次,較FY2022的115次增加了46%(見下圖)。
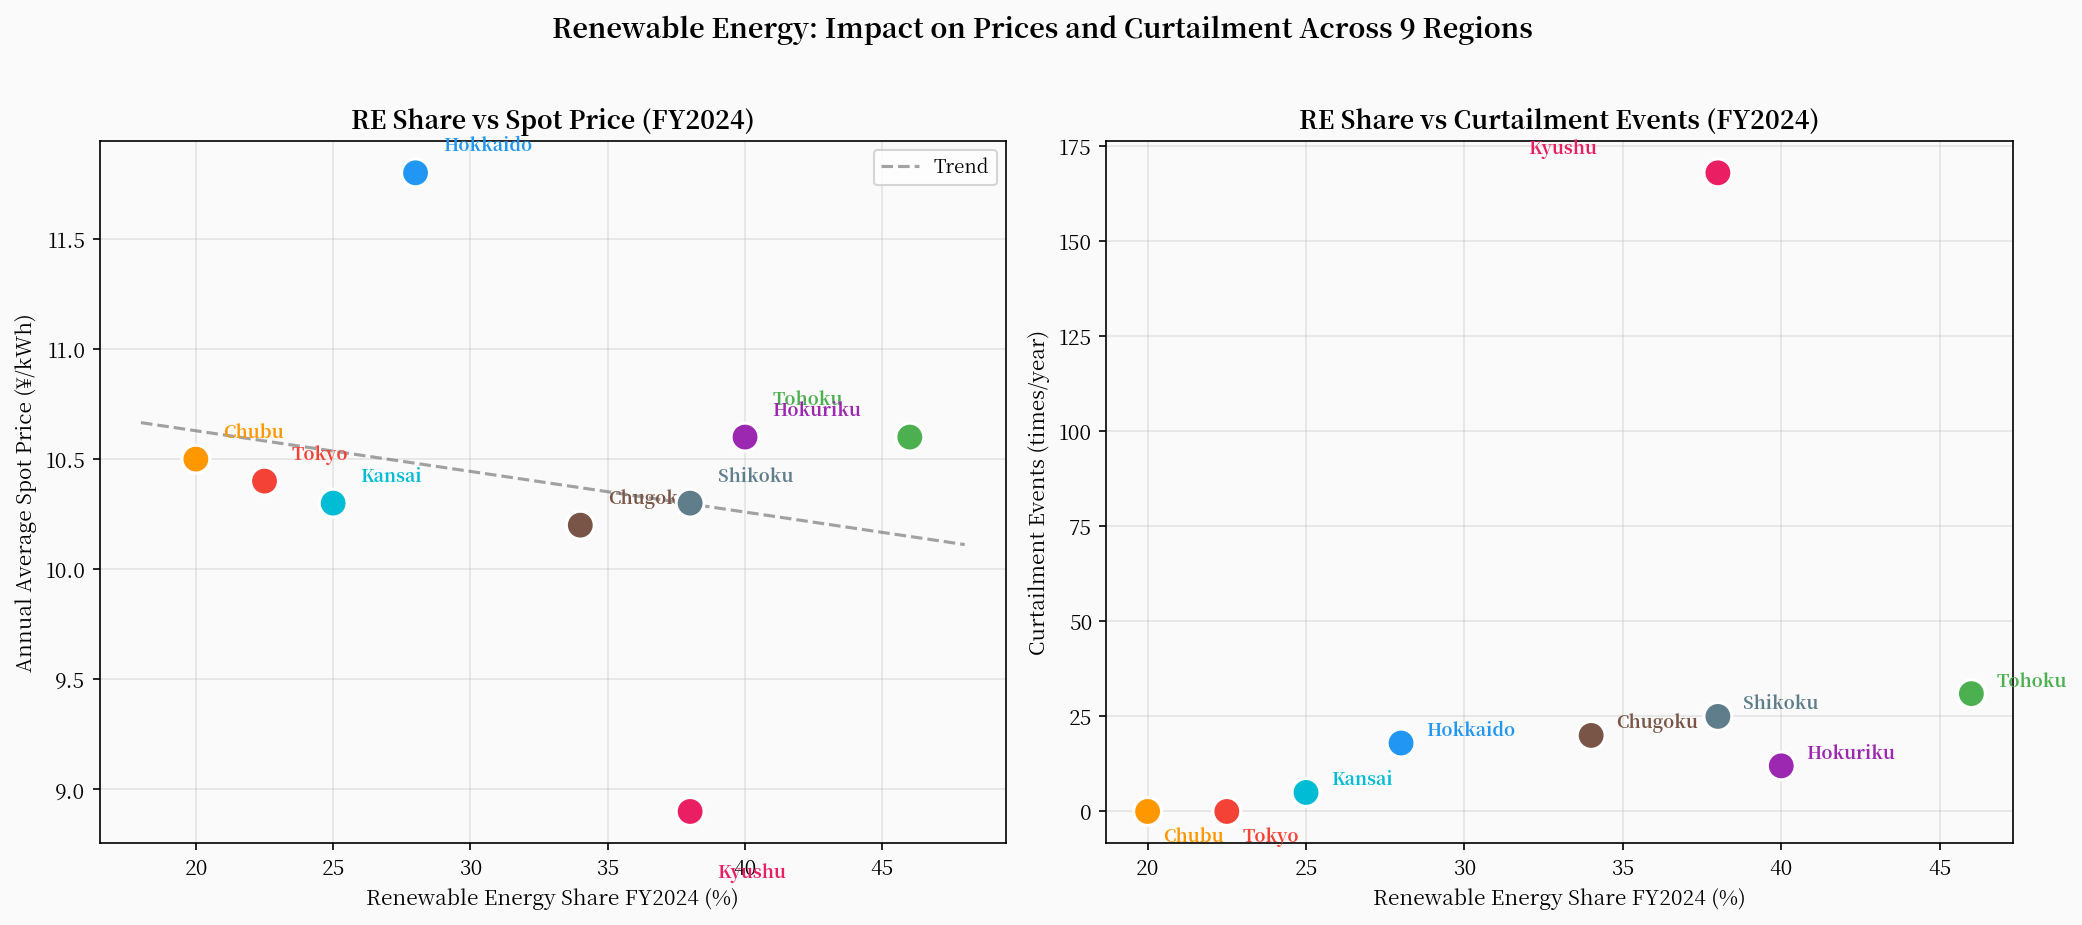
棄電問題的根本原因在於「供給過剩+連系線壅塞」的雙重制約。當太陽能大量出力時,若核電基礎負荷無法快速降低,且連系線容量不足以將過剩電力輸往需求較高的區域,棄電便成為維持系統頻率的唯一手段。
東北的情況同樣值得關注:儘管再生能源比例高達46%,但棄電次數在FY2024達到31次,且呈現加速增長趨勢。女川2號機的重啟(2024年11月)進一步壓縮了系統的調整裕度,預計FY2025–FY2026的棄電壓力將持續上升。
九州棄電的月度分布:春秋雙峰結構
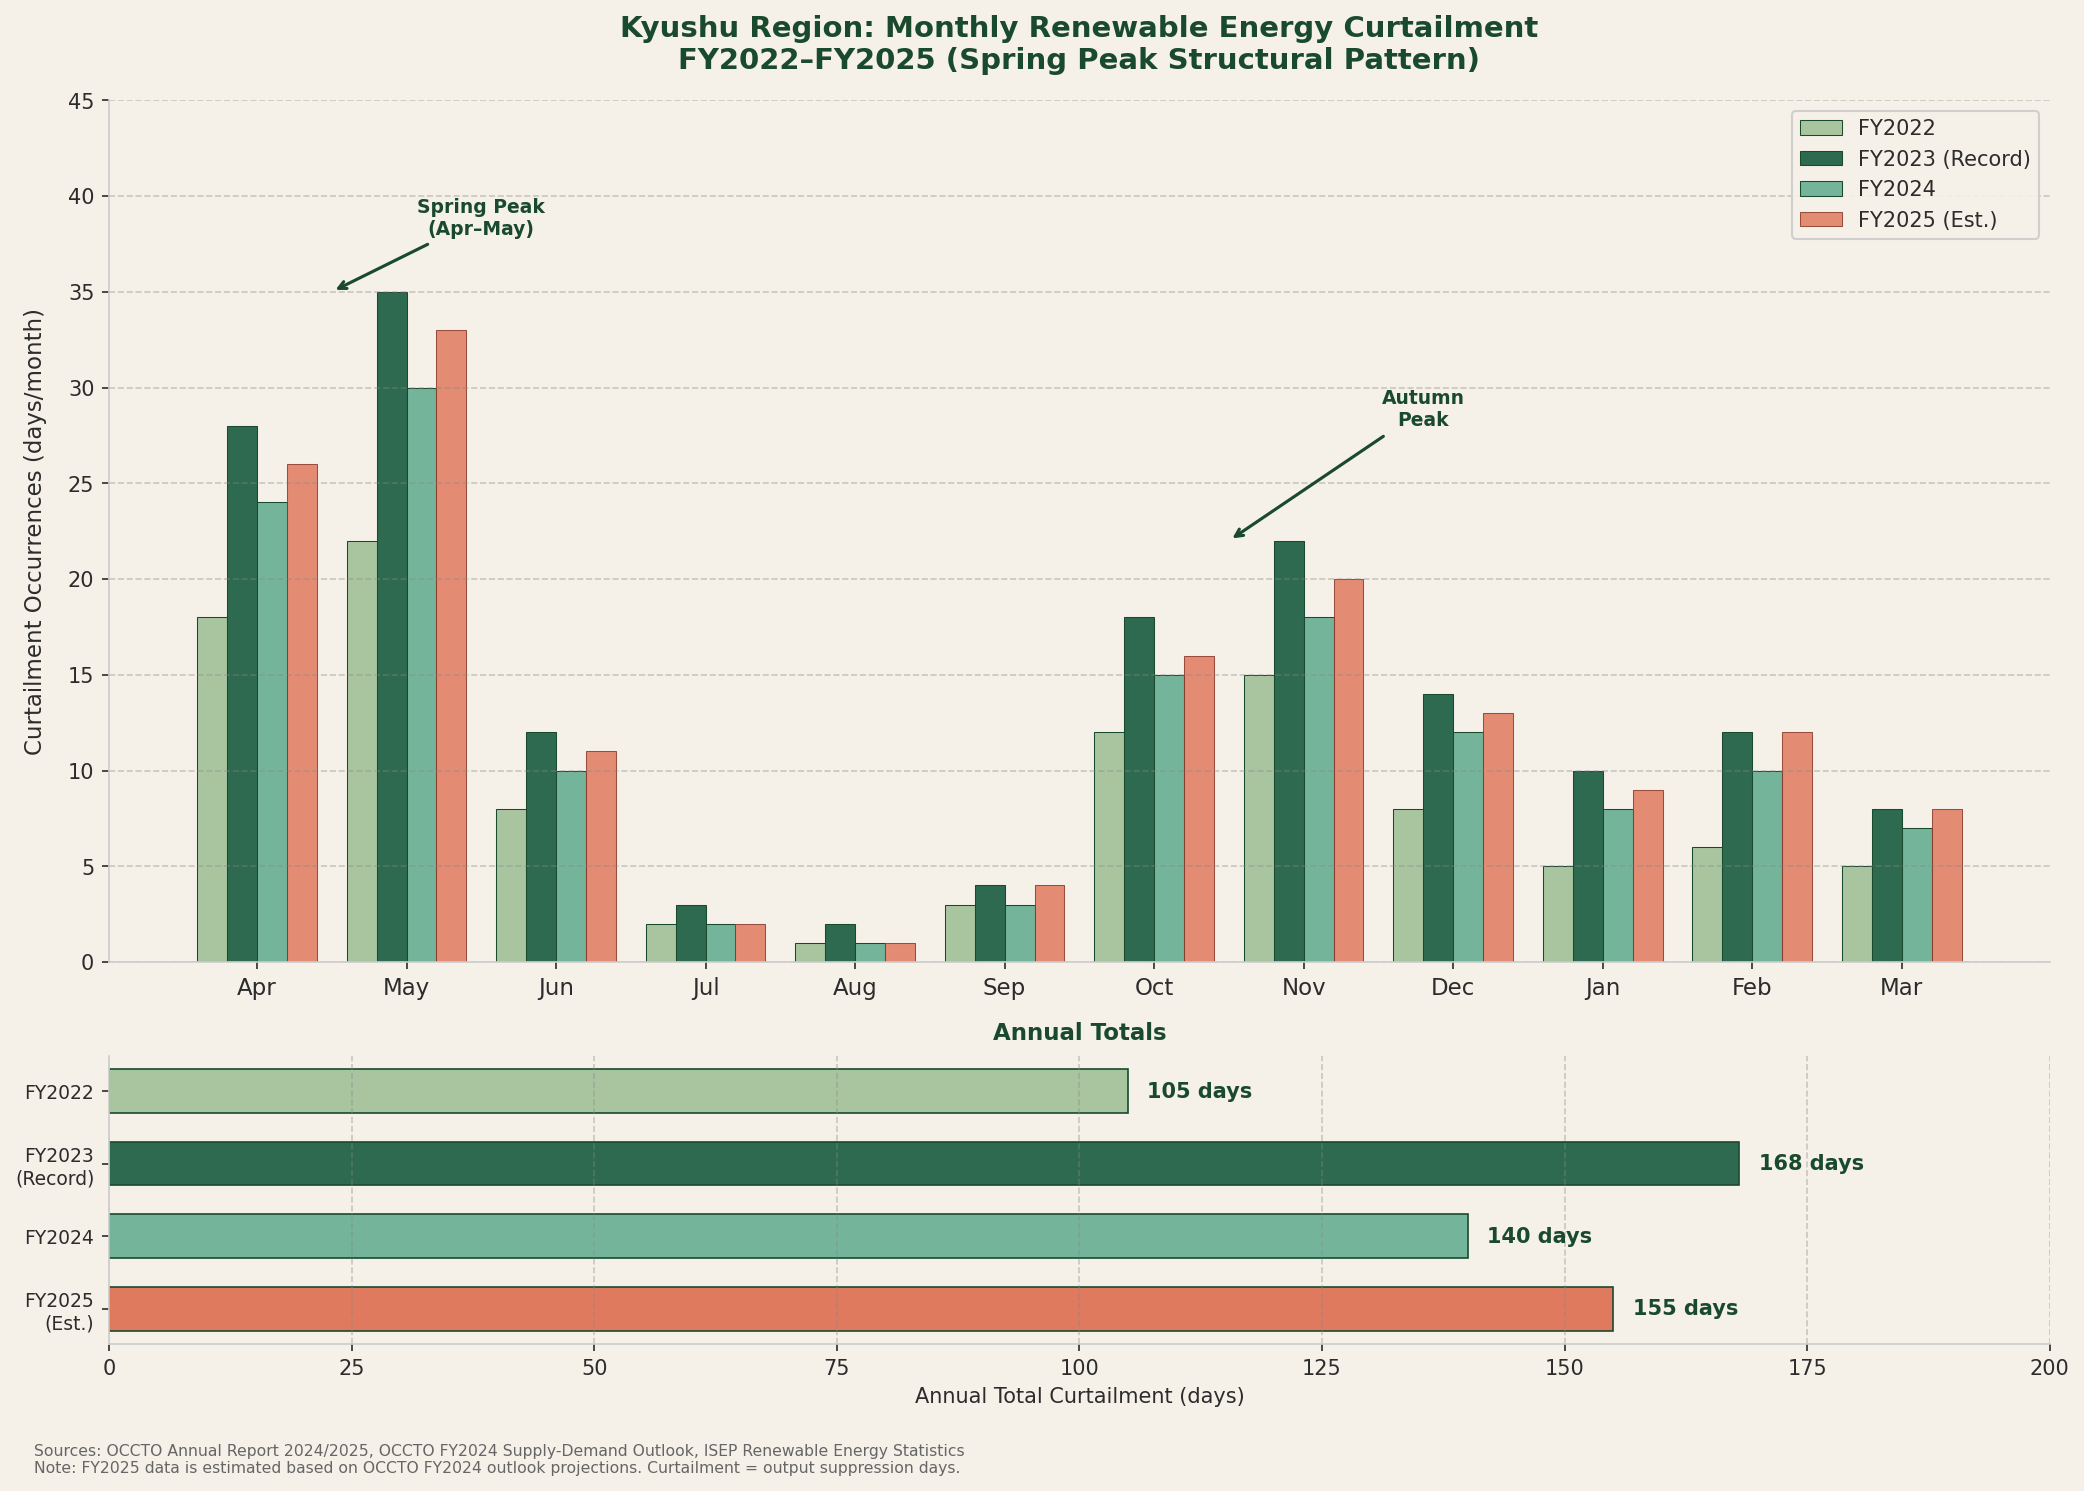
月度分布圖揭示了棄電的季節性雙峰結構:4–5月(春季)和10–11月(秋季)是棄電高峰,夏季(7–8月)因冷氣需求高而棄電次數極低。這一模式直接反映了太陽能出力與系統需求的錯配——春秋兩季日照充足但需求偏低,加之核電無法靈活調度,系統調整裕度最為緊張。
對於BESS投資者而言,春秋兩季的棄電高峰期也是套利機會最密集的時段:白天吸收棄電(低價充電)、傍晚尖峰放電,可最大化價差收益。FY2025的預估數據顯示,棄電壓力將持續高於FY2024,BESS套利窗口有望進一步擴大。
五、關鍵指標熱力圖:三年趨勢的全貌
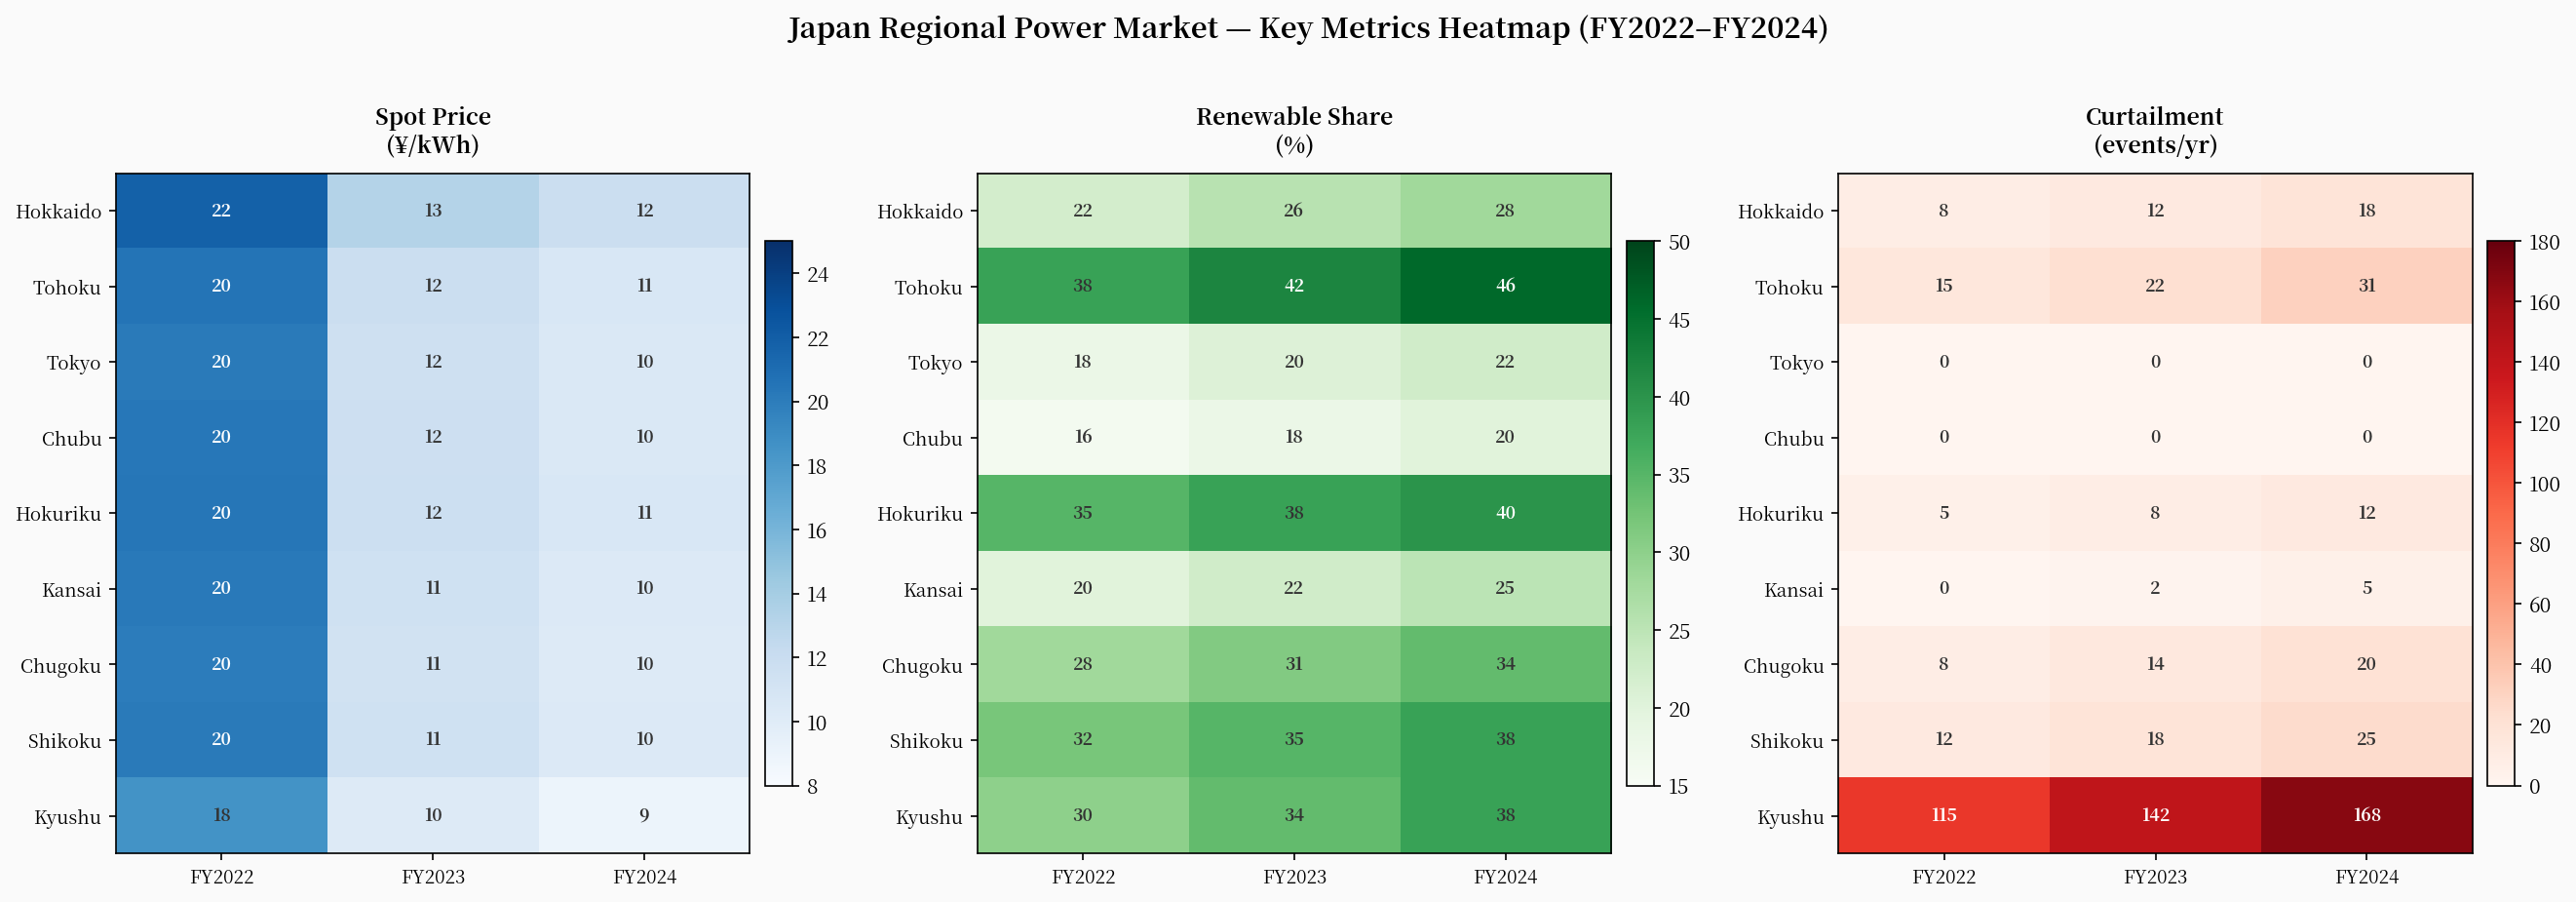
熱力圖清晰呈現了三個核心趨勢:
- 現貨價格全面下行:所有區域均從FY2022的高點回落,九州降幅最大(¥18→¥9)。
- 再生能源比例持續提升:東北(38%→46%)、九州(30%→38%)、四國(32%→38%)增速最快。
- 棄電集中在西日本:九州遠超其他區域,東北、四國、中國、北海道次之,東京、中部、關西幾乎為零。
六、再生能源趨勢展望:FY2026的結構性壓力
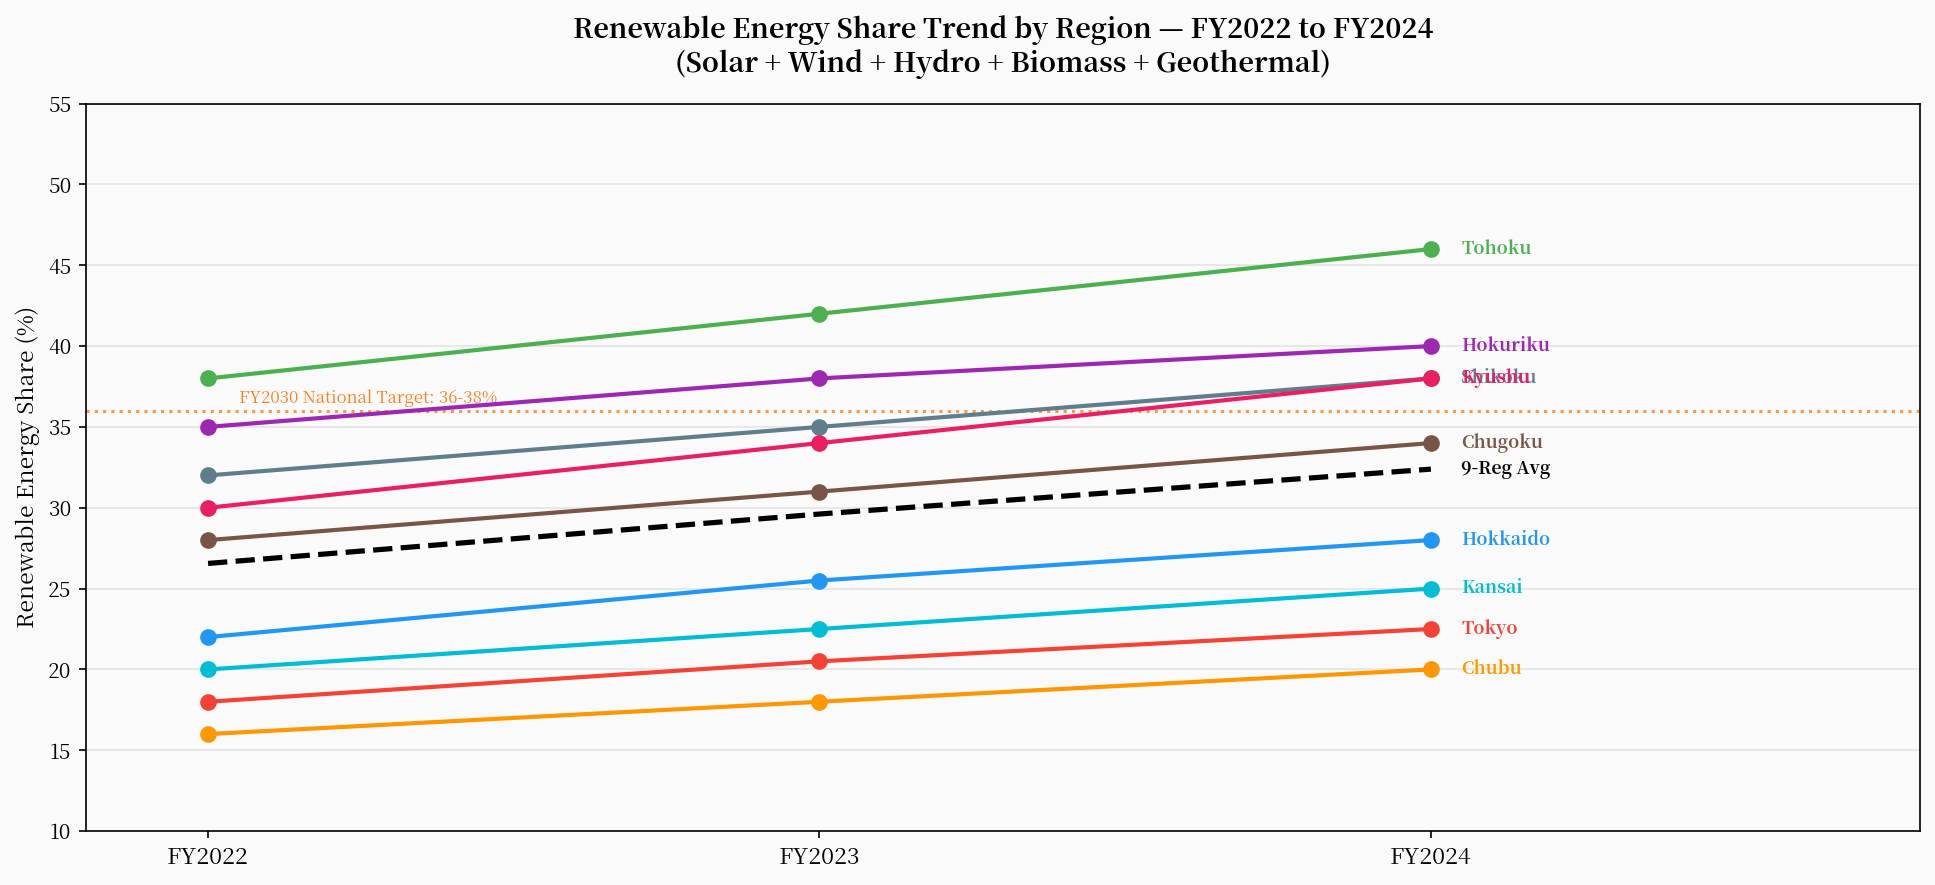
基於OCCTO FY2024供需展望及各區域再生能源新增裝機計畫,FY2025–FY2026期間,東北、九州、四國的再生能源比例預計將分別突破50%、42%及42%。這將進一步加劇棄電壓力,並推高這些區域的不平衡價格波動性。
FY2026的另一關鍵變數是日前市場(前日市場)的全面啟動。EPRX調整力市場從FY2026年度起將部分商品移至日前市場競標,這將改變調整力供給側的行為模式,並對現貨與不平衡價格的聯動關係產生新的影響。
七、對BESS投資策略的啟示
綜合以上分析,不同區域的BESS套利機會存在顯著差異:
| 區域 | 現貨套利潛力 | 不平衡套利潛力 | 棄電充電機會 | 綜合評分 |
|---|---|---|---|---|
| 九州 | 高(日間低谷深) | 高(波動大) | 非常高(168次/年) | ⭐⭐⭐⭐⭐ |
| 東北 | 中 | 中高 | 高(31次/年,增速快) | ⭐⭐⭐⭐ |
| 四國 | 中高 | 高 | 高(25次/年) | ⭐⭐⭐⭐ |
| 中國 | 中 | 中 | 中(20次/年) | ⭐⭐⭐ |
| 北海道 | 中(連系線溢價) | 中 | 中(18次/年) | ⭐⭐⭐ |
| 東京 | 低(價差小) | 低 | 極低(0次) | ⭐⭐ |
| 關西 | 低 | 低 | 極低(5次/年) | ⭐⭐ |
| 中部 | 低 | 低 | 極低(0次) | ⭐⭐ |
| 北陸 | 低中 | 低中 | 低(12次/年) | ⭐⭐ |
九州持續是BESS套利最具吸引力的區域,但隨著競爭加劇和連系線擴容計畫推進(九州—中國地方增容預計2027年完工),套利空間可能逐步收窄。東北因女川核電重啟後棄電壓力加速上升,正成為下一個值得重點關注的套利機會窗口。
結語
日本九大電力區域的電力市場正在經歷深刻的結構性轉型。電源組合的差異決定了邊際成本的基準,再生能源滲透率的快速提升重塑了日間價格曲線,而連系線容量的限制則放大了區域間的價格分化。不平衡價格作為系統調整的最後防線,在高再生能源區域呈現出持續的結構性溢價。
對於電力交易者和BESS投資者而言,理解這些區域差異的成因與演變趨勢,是在FY2025–FY2026市場環境中制定有效策略的核心能力。
參考資料
- OCCTO. "Outlook for Electricity Supply-Demand and Cross-Regional Interconnection Lines FY2024." November 2025.
- OCCTO. "Annual Report 2025." January 2026.
- ISEP. "自然エネルギー電力の割合(2024年度)." 2025.
- Asia RE Engage. "Japan's Power Market Transition." November 2025.
- Skipping Stone. "Japan Energy Market Update 2024." October 2024.
日本9エリア電力市場の深層分析:電源構成・現物価格・インバランス価格・再エネ比率の相互影響(FY2022–FY2026)
序論:なぜ9エリアの電力市場はこれほど異なるのか
日本の電力システムは9つの電力エリアで構成されており、各エリアは電源構成・負荷特性・再生可能エネルギー浸透率・連系線容量において顕著な差異を持つ。これらの構造的差異は、各エリアの現物(JEPX前日スポット)均価を決定するだけでなく、インバランス価格の形成メカニズムや再生可能エネルギーの出力制御の頻度・規模にも深く影響する。
FY2022〜FY2024の間、全国JEPX系統均価は約¥20/kWhから¥10〜12/kWhへと40%以上下落した。しかしこのマクロトレンドは、エリア間の顕著な価格分化を覆い隠している。九州は太陽光の大量浸透により全国均価を継続的に下回り、北海道は連系線容量制約によりプレミアムを示す。これらの差異を理解することは、エリア別の電力取引戦略の策定とBESS投資収益の評価において不可欠な前提条件である。
1. 電源構成のエリア分化:原子力主導から再エネ最前線まで
FY2024年、9エリアの電源構成は大きく異なる構造的特徴を示している(下図参照)。
関西・九州・四国の3エリアは稼働中の原子力機組を持ち、原子力比率はそれぞれ28%・22%・20%に達する。これはLNG火力主体の東京(40%)や中部(35%)と対照的なコスト構造をもたらす。北海道は石炭(35%)を基幹電源とし、比較的高い風力比率(12%)を持つ独特の「石炭+風力」構成を示す。
東北は全国で最も再エネ比率が高いエリアであり、太陽光+風力+水力の合計は46%に達する。しかし東京との連系線容量(約1,200MW)に制約され、大量の安価な電力を南送できない構造的な「北電南不足」問題が生じている。
2. 現物価格トレンド:全面下落の中のエリア分化
FY2022のエネルギー危機は全国現物均価を¥18〜22/kWhへ押し上げた。LNG現物価格の下落・原子力再稼働の進展・再エネ浸透率の向上により、FY2023〜FY2024には¥9〜13/kWhへ大幅に下落した(下図参照)。
九州のFY2024年均現物価格は約¥9/kWhと全国最低であり、東京より約10%低い。この現象は以下3つの構造的要因の重なりによる。
- 原子力の低限界費用:川内・玄海4機組の継続稼働により大量の低限界費用ベース電力が供給される。
- 太陽光の大量浸透:九州の太陽光設備容量は14GWを超え、昼間の供給過剰が頻発する。
- 連系線容量制約:九州から中国地方への連系線容量が限られ、過剰電力の北送が困難なため、エリア内低価格が形成される。
3. インバランス価格:高再エネエリアの隠れたリスク
インバランス価格は電力市場で最も変動性の高い価格シグナルである。再エネ比率の高いエリアでは、太陽光発電の日内変動によりインバランス量が頻繁に発生し、インバランス価格のピーク値と均値を押し上げる。
FY2024データによると、九州・四国等の高再エネエリアのインバランス価格年均プレミアム(現物均価比)は1.5〜2倍に達する。これは、これらのエリアでは電力小売業者が負荷や発電量を正確に予測できない場合、著しく高いインバランス費用に直面することを意味する。
4. 再エネ比率と出力制御:九州問題の全国的縮図
再エネ浸透率の急速な上昇は出力制御問題の急激な悪化をもたらした。FY2024年、九州の出力制御回数は168回に達し、FY2022の115回から46%増加した(下図参照)。
出力制御問題の根本原因は「供給過剰+連系線混雑」の二重制約にある。太陽光が大量出力する際、原子力ベース負荷を迅速に下げられず、かつ連系線容量が過剰電力を需要の高いエリアへ送電するのに不十分な場合、出力制御がシステム周波数維持の唯一の手段となる。
九州の出力制御の月別分布:春秋二峰構造
月別分布図は出力制御の季節的二峰構造を明確に示している。4〜5月(春季)と10〜11月(秋季)が制御ピークとなり、夏季(7〜8月)は冷房需要が高いため制御回数が極めて少ない。このパターンは太陽光出力とシステム需要のミスマッチを直接反映している——春秋両季は日照が豊富だが需要が低く、原子力の柔軟な調整も困難なため、系統調整余力が最も逼迫する。
BESSの投資家にとって、春秋両季の出力制御ピーク期は裁定機会が最も集中する時期でもある:昼間に出力制御電力を吸収(低価格充電)し、夕方のピーク時に放電することで価格差収益を最大化できる。FY2025の推計データは出力制御圧力がFY2024を上回ることを示しており、BESS裁定ウィンドウのさらなる拡大が期待される。
5. 主要指標ヒートマップ:3年間のトレンド全体像
ヒートマップは3つのコアトレンドを明確に示している。
- 現物価格の全面下落:全エリアがFY2022の高値から下落し、九州の下落幅が最大(¥18→¥9)。
- 再エネ比率の持続的上昇:東北(38%→46%)・九州(30%→38%)・四国(32%→38%)の増加速度が最速。
- 出力制御の西日本集中:九州が他エリアを大きく上回り、東北・四国・中国・北海道が続く。東京・中部・関西はほぼゼロ。
6. 再エネトレンド展望:FY2026の構造的圧力
OCCTO FY2024需給見通しおよび各エリアの再エネ新規設備計画に基づくと、FY2025〜FY2026にかけて東北・九州・四国の再エネ比率はそれぞれ50%・42%・42%を突破する見込みである。これにより出力制御圧力がさらに高まり、これらエリアのインバランス価格変動性も上昇すると予測される。
7. BESS投資戦略への示唆
以上の分析を総合すると、エリアによってBESS裁定機会は大きく異なる。九州は引き続きBESS裁定の最も魅力的なエリアであるが、競争激化と連系線増強計画(九州〜中国地方増強、2027年完工予定)の進展により、裁定余地は徐々に縮小する可能性がある。東北は女川再稼働後の出力制御圧力加速により、次に注目すべき裁定機会の窓口となりつつある。
参考資料
Japan's Nine-Region Power Market Deep Dive: How Power Mix, Spot Prices, Imbalance Prices, and Renewable Ratios Interact (FY2022–FY2026)
Introduction: Why Are Japan's Nine Regional Power Markets So Different?
Japan's electricity system comprises nine regional grid areas, each exhibiting significant differences in power generation mix, load characteristics, renewable energy penetration, and interconnection capacity. These structural differences not only determine the spot (JEPX day-ahead) average prices in each region but also profoundly influence the formation mechanism of imbalance prices and the frequency and scale of renewable energy curtailment.
During FY2022–FY2024, the national JEPX system average price fell from approximately ¥20/kWh to ¥10–12/kWh, a decline of over 40%. However, this macrotrend masks significant price divergence between regions: Kyushu persistently underperforms the national average due to massive solar penetration, while Hokkaido commands a premium due to interconnection capacity constraints. Understanding these differences is a core prerequisite for formulating regional electricity trading strategies and evaluating BESS investment returns.
1. Regional Divergence in Power Mix: From Nuclear-Dominated to Renewable Frontiers
In FY2024, the nine regions exhibit markedly different structural characteristics in their power generation mix (see figure below).
Kansai, Kyushu, and Shikoku have operating nuclear units, with nuclear shares reaching 28%, 22%, and 20% respectively — creating a stark contrast in marginal cost structure compared to LNG-heavy Tokyo (40%) and Chubu (35%). Hokkaido relies on coal (35%) as its base power source and has a relatively high wind share (12%), presenting a distinctive "coal + wind" combination.
Tohoku has the highest renewable energy share in the country, with solar + wind + hydro combined reaching 46%. However, constrained by interconnection capacity to Tokyo (approximately 1,200 MW), large volumes of cheap electricity cannot be transmitted southward, creating a structural "northern surplus, southern deficit" problem.
| Region | Primary Base Power | Renewable Share (FY2024 est.) | Nuclear Status |
|---|---|---|---|
| Hokkaido | Coal (35%) | 28% | Tomari 1–3 offline |
| Tohoku | LNG (18%) + Renewables | 46% | Onagawa Unit 2 restarted (Nov 2024) |
| Tokyo | LNG (40%) | 22% | Kashiwazaki-Kariwa under review |
| Chubu | LNG (35%) + Coal (35%) | 20% | Hamaoka all units offline |
| Hokuriku | Coal (38%) + Hydro (28%) | 40% | Shika under review |
| Kansai | Nuclear (28%) | 25% | Ohi 3–4, Takahama 1–4 operating |
| Chugoku | Coal (42%) | 34% | Shimane Unit 2 restarted (Dec 2024) |
| Shikoku | LNG (18%) + Coal (20%) | 38% | Ikata Unit 3 operating |
| Kyushu | Nuclear (22%) | 38% | Sendai 1–2, Genkai 3–4 operating |
2. Spot Price Trends: Regional Divergence Within a Broad Decline
The FY2022 energy crisis pushed national spot averages to ¥18–22/kWh. As LNG spot prices retreated, nuclear restarts progressed, and renewable penetration increased, FY2023–FY2024 saw prices fall sharply to ¥9–13/kWh (see figure below).
Kyushu's FY2024 annual average spot price of approximately ¥9/kWh is the lowest among all regions, about 10% below Tokyo. This phenomenon stems from the convergence of three structural factors:
- Nuclear low marginal cost: Continuous operation of Sendai and Genkai's four units provides large volumes of low-marginal-cost baseload power.
- Massive solar penetration: Kyushu's solar installed capacity exceeds 14 GW, causing frequent daytime supply surpluses.
- Interconnection capacity constraints: Limited interconnection capacity from Kyushu to Chugoku makes it difficult to export surplus power northward, creating regional low prices.
By contrast, Hokkaido commands a relative premium due to interconnection constraints (the Hokkaido-Honshu HVDC link is only 600 MW), with FY2024 average prices around ¥12/kWh — approximately 33% above Kyushu.
3. Imbalance Prices: The Hidden Risk in High-Renewable Regions
Imbalance prices are the most volatile price signal in the electricity market. In regions with high renewable shares, the intraday variability of solar generation causes frequent imbalance volumes, pushing up both the peak and average of imbalance prices.
FY2024 data shows that high-renewable regions such as Kyushu and Shikoku exhibit annual average imbalance price premiums (relative to spot average) of 1.5–2×. This means that in these regions, electricity retailers who fail to accurately forecast load or generation face significantly higher imbalance costs.
The structural imbalance price premium also creates arbitrage opportunities for BESS: charging at low prices during daytime solar peaks (even at negative prices during curtailment events), discharging at high prices during evening load peaks, while simultaneously providing imbalance adjustment services.
4. Renewable Share and Curtailment: Kyushu's Predicament as a National Microcosm
The rapid increase in renewable penetration has led to a sharp deterioration in curtailment problems. In FY2024, Kyushu's curtailment events reached 168 times, a 46% increase from 115 times in FY2022 (see figure below).
The root cause of curtailment lies in the dual constraint of "supply surplus + interconnection congestion." When solar generates heavily, if nuclear baseload cannot be reduced quickly and interconnection capacity is insufficient to transmit surplus power to higher-demand regions, curtailment becomes the only means of maintaining system frequency.
Tohoku's situation also warrants attention: despite a renewable share as high as 46%, curtailment events reached 31 times in FY2024 with an accelerating growth trend. The restart of Onagawa Unit 2 (November 2024) further compresses the system's adjustment margin, and curtailment pressure is expected to continue rising in FY2025–FY2026.
Kyushu Curtailment Monthly Distribution: A Spring-Autumn Dual-Peak Structure
The monthly distribution chart reveals a clear seasonal dual-peak structure: April–May (spring) and October–November (autumn) are the curtailment peaks, while summer (July–August) sees minimal curtailment due to high air-conditioning demand. This pattern directly reflects the mismatch between solar output and system demand — spring and autumn have abundant sunshine but lower demand, compounded by nuclear inflexibility, creating the tightest system adjustment margins of the year.
For BESS investors, the spring and autumn curtailment peaks are also the most arbitrage-dense periods: absorbing curtailed power during the day (low-price charging) and discharging during the evening peak maximizes price-spread revenue. FY2025 estimates indicate curtailment pressure will remain above FY2024 levels, with BESS arbitrage windows expected to widen further.
5. Key Metrics Heatmap: The Full Picture of Three-Year Trends
The heatmap clearly reveals three core trends:
- Broad spot price decline: All regions have retreated from FY2022 highs, with Kyushu showing the largest decline (¥18→¥9).
- Sustained renewable share growth: Tohoku (38%→46%), Kyushu (30%→38%), and Shikoku (32%→38%) are growing fastest.
- Curtailment concentrated in western Japan: Kyushu far exceeds other regions, followed by Tohoku, Shikoku, Chugoku, and Hokkaido. Tokyo, Chubu, and Kansai are near zero.
6. Renewable Trend Outlook: Structural Pressure in FY2026
Based on OCCTO's FY2024 supply-demand outlook and each region's renewable new capacity plans, Tohoku, Kyushu, and Shikoku's renewable shares are projected to exceed 50%, 42%, and 42% respectively during FY2025–FY2026. This will further intensify curtailment pressure and increase imbalance price volatility in these regions.
Another key variable for FY2026 is the full launch of the day-ahead market (前日市場). From FY2026, the EPRX balancing market will shift some products to day-ahead competitive bidding, which will change the behavioral patterns of the adjustment power supply side and create new influences on the linkage between spot and imbalance prices.
7. Implications for BESS Investment Strategy
Synthesizing the above analysis, BESS arbitrage opportunities vary significantly by region. Kyushu remains the most attractive region for BESS arbitrage, but as competition intensifies and interconnection expansion plans progress (Kyushu–Chugoku capacity increase expected to complete in 2027), arbitrage margins may gradually narrow. Tohoku, with accelerating curtailment pressure following the Onagawa restart, is emerging as the next window of arbitrage opportunity worth close attention.
References
- OCCTO. "Outlook for Electricity Supply-Demand and Cross-Regional Interconnection Lines FY2024." November 2025.
- OCCTO. "Annual Report 2025." January 2026.
- ISEP. "自然エネルギー電力の割合(2024年度)." 2025.
- Asia RE Engage. "Japan's Power Market Transition." November 2025.
- Skipping Stone. "Japan Energy Market Update 2024." October 2024.