Executive Summary
Japan faces dual structural challenges: a digital trade deficit (¥6.85 trillion in 2024) and insufficient AI compute capacity. METI's "Watt-Bit Collaboration" strategy and the GX Strategic Zone System provide strong policy incentives for distributed, renewable-powered AI data centers. Converting existing 2MW grid-scale battery (BESS) sites into GPU compute centers represents a strategically viable transformation under the right conditions.
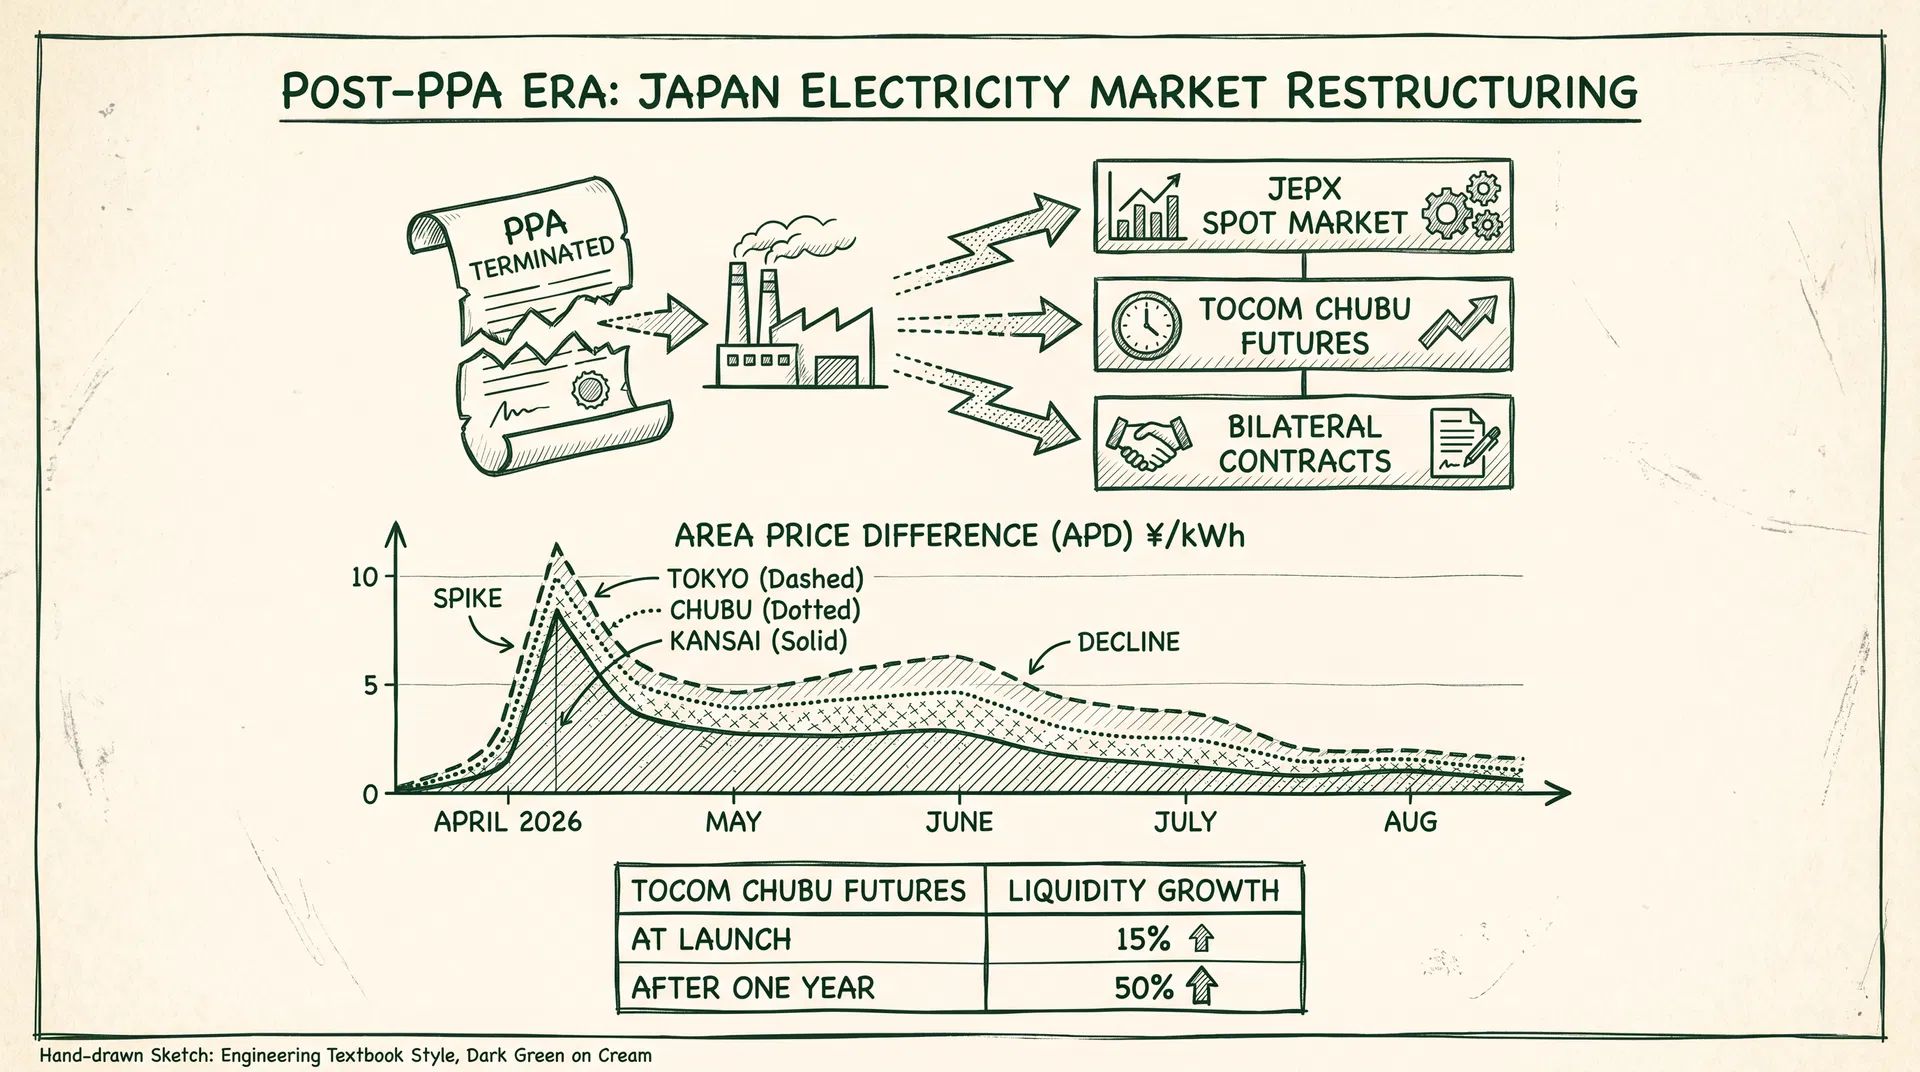
However, the market environment has changed dramatically since the GPU shortage peak of 2023. This article uses April 2026 market data to correct key assumptions in the revenue model and provide a more realistic financial assessment framework.
Chapter 1: Power Capacity Fit
2MW is a viable entry-scale for AI compute data centers. At METI's maximum PUE of 1.3, approximately 1,538 kW (76.9%) of the 2MW total is available for IT equipment. A GPU inference configuration can accommodate approximately 616 H100 GPUs, delivering ~2.5 ExaFLOPS—equivalent to 4.2% of METI's 60 ExaFLOPS target for FY2027, meaningful for a distributed deployment strategy.
| Configuration | Power Density/Rack | Racks | GPU Count (H100) | Compute Scale (FP8) |
|---|---|---|---|---|
| GPU Training | 40 kW | ~38 racks | ~304 GPUs | ~1.2 ExaFLOPS |
| GPU Inference | 20 kW | ~77 racks | ~616 GPUs | ~2.5 ExaFLOPS |
| GPU Mixed | 30 kW | ~51 racks | ~410 GPUs | ~1.6 ExaFLOPS |
| B200 Next-Gen | 80 kW | ~19 racks | ~152 B200 GPUs | ~3.0 ExaFLOPS |
Chapter 2: Land Use Compliance
Sites in industrial zones (工業地域) or quasi-industrial zones (準工業地域) can be converted to data centers through standard building permit applications (3–9 months) without rezoning. Urbanization control areas (市街化調整区域) require development permits (6–18 months). Agricultural promotion zones and protected forests are prohibited.
A key regulatory note: the Ministry of Land Infrastructure and Transport's April 2025 notification (国都計第7号) clarified the legal basis for BESS installations in urbanization control areas, but this applies only to battery facilities—data centers in the same zone still require separate development permits.
Chapter 3: Construction Cost Structure
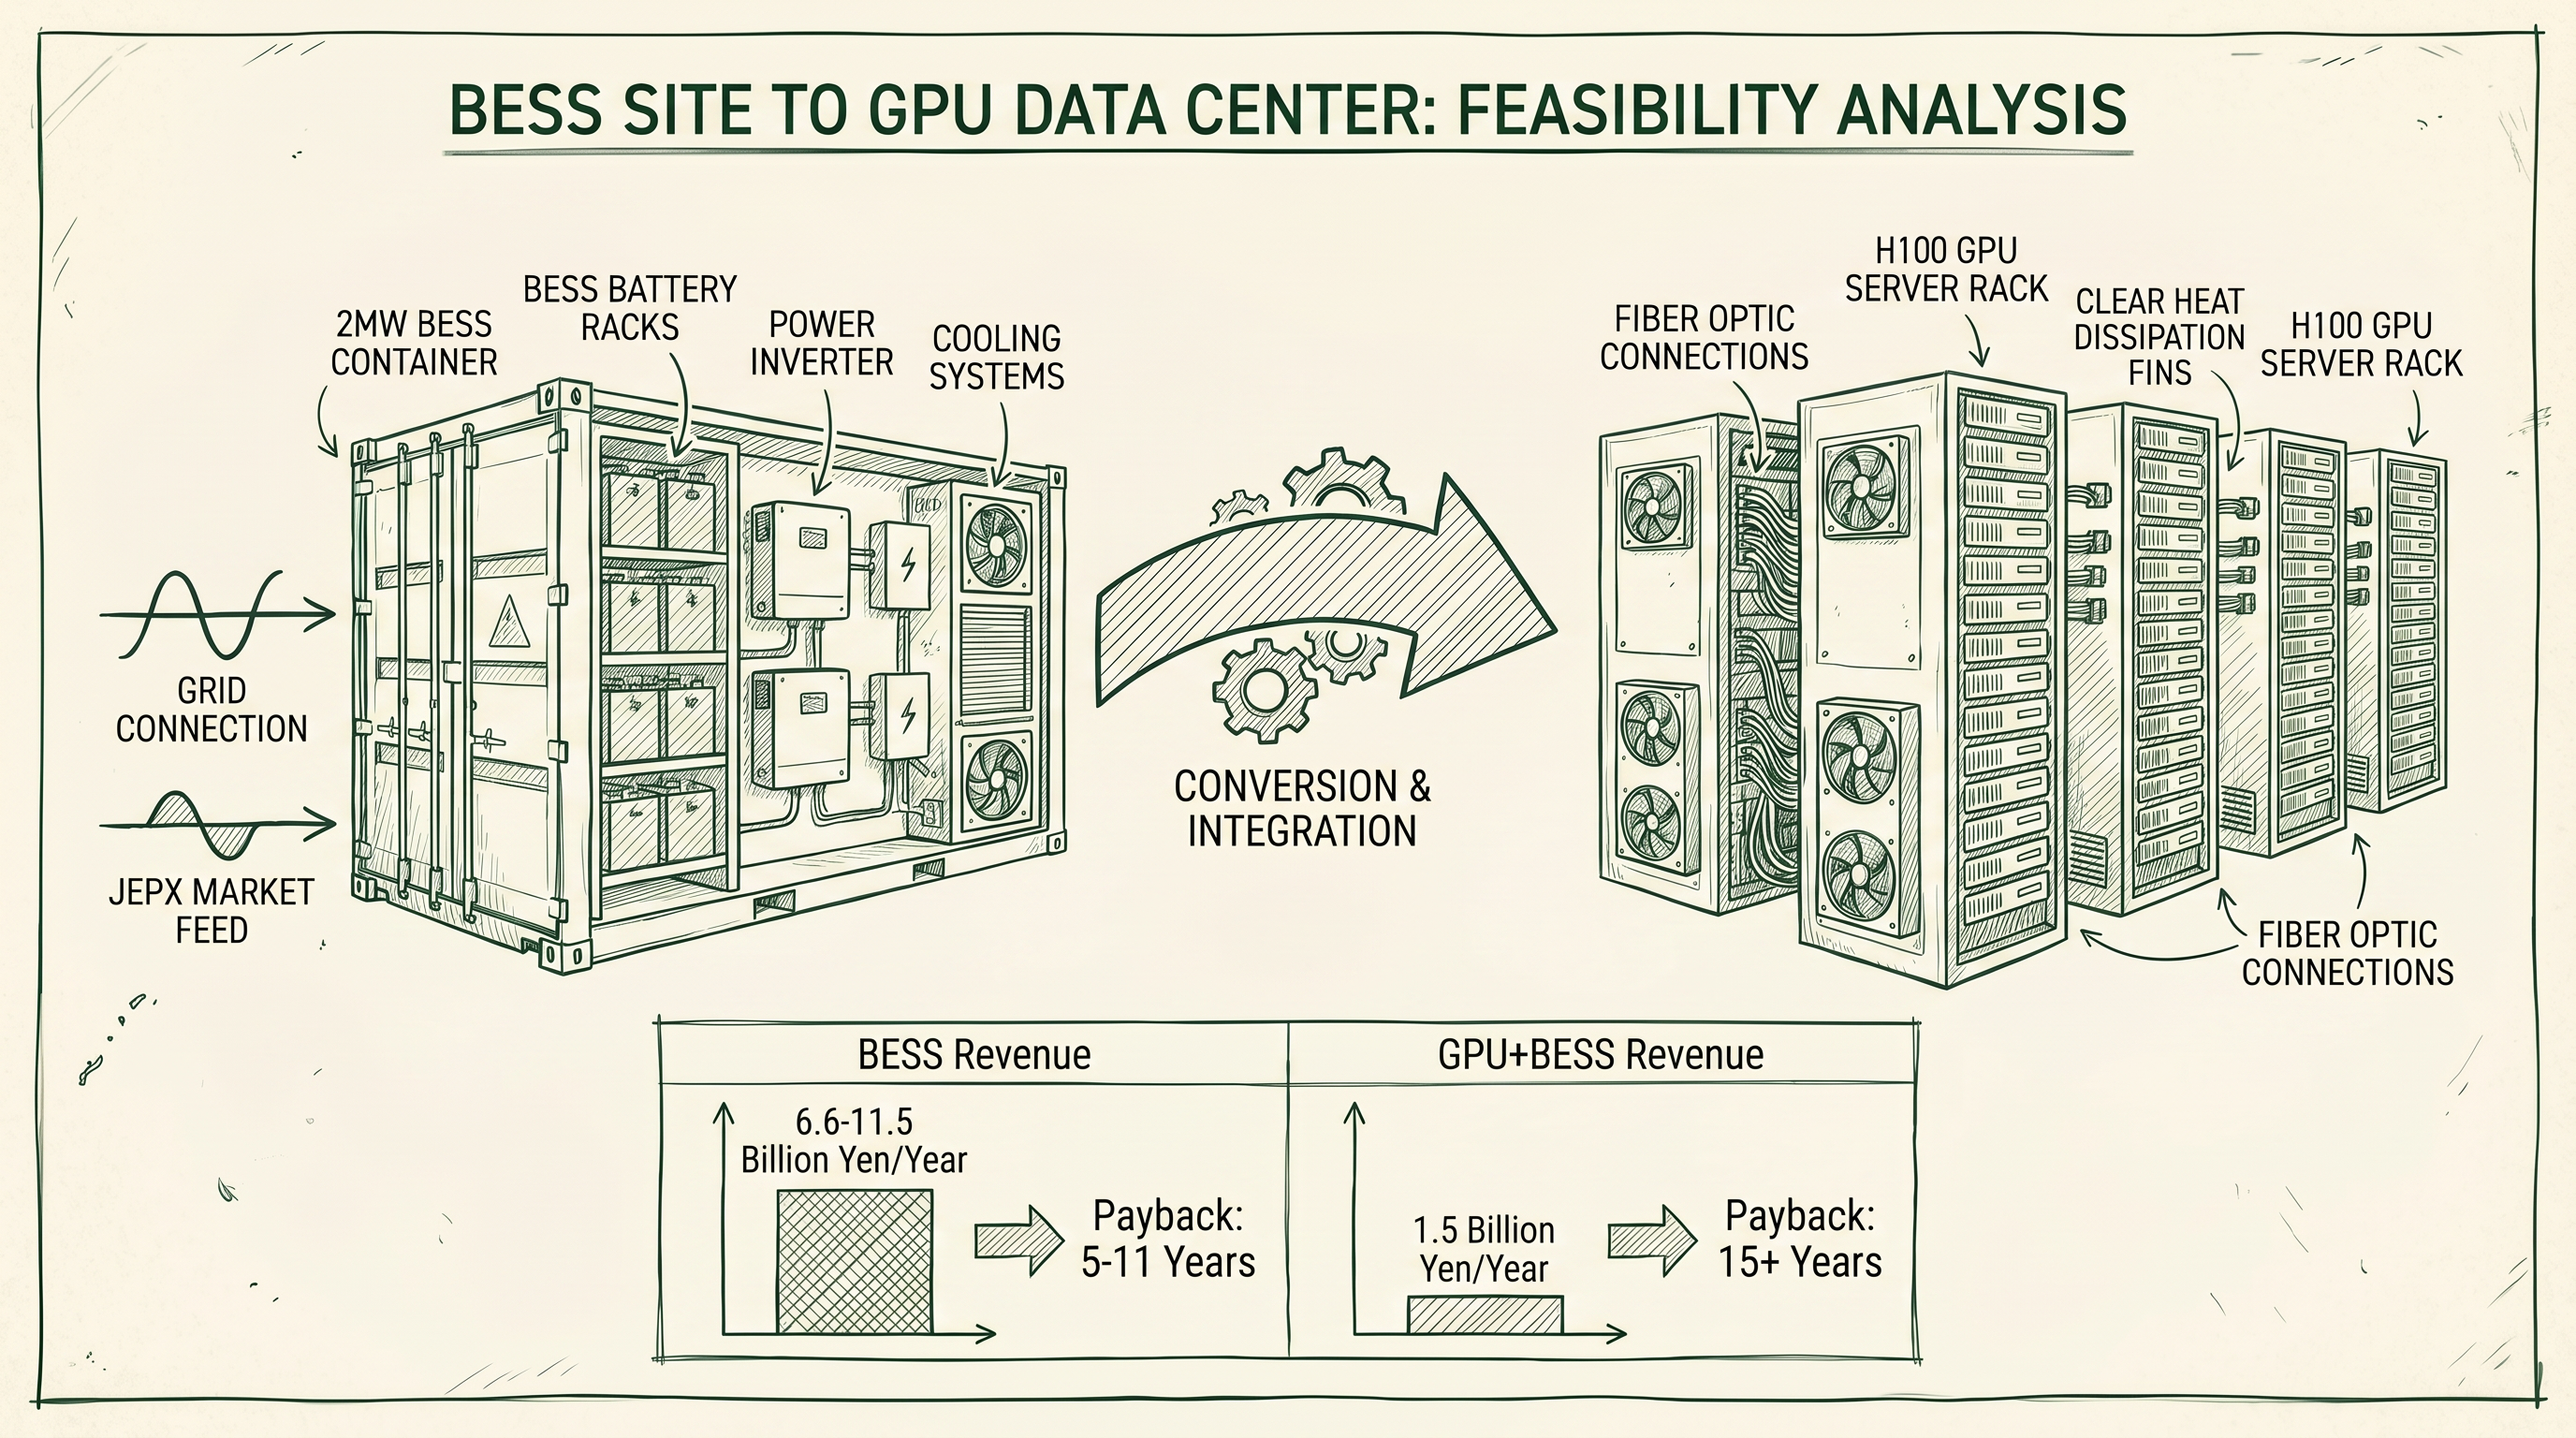
AI compute centers cost significantly more than traditional data centers due to liquid cooling systems, high-density power distribution, and structural reinforcement (floor load ≥ 2 tons/m²). After GX subsidies (up to 50%), the out-of-pocket cost for a 2MW GPU inference center is ¥5–7 billion. The key advantage of BESS sites is that power infrastructure is already in place, saving ¥500 million–1.5 billion and 12–18 months of construction time.
Chapter 4: Fiber Connectivity Assessment
Fiber connectivity is the second most critical site selection factor. A five-step evaluation framework covers: trunk fiber distance (≤500m excellent), IX proximity (≤100km for <1ms latency), dark fiber availability, redundant routing feasibility, and future infrastructure development plans. A score of 70+ out of 100 is recommended to proceed.
Chapter 5: Cooling Water Assessment
AI GPU data centers require 3–5× more cooling than traditional facilities. Four cooling water categories are evaluated: industrial water supply (best), river/lake water (conditionally viable), groundwater (high risk), and recycled water/waste heat (innovative option). Immersion liquid cooling reduces annual water consumption to 180,000–530,000 liters, far below traditional evaporative cooling (3.15–5.25 million liters), and earns GX subsidy bonus points.
Chapter 6: GX Strategic Zone Positioning and Subsidies
METI announced 38 GX Strategic Zone candidate areas on April 24, 2026, across three types: Data Center Cluster (9 zones), Industrial Complex Regeneration (6 zones), and Decarbonized Power Utilization (23 zones, 44 blocks). The maximum subsidy rate is 50%, with a cap of ¥5–25 billion per project. The core requirement is 100% decarbonized electricity, achieved through long-term PPAs (~20 years) or tracked non-fossil certificates.
Notably, Kagawa Prefecture is the only region selected for both the Data Center Cluster and Industrial Complex Regeneration types, reflecting its structural advantages in power, communications infrastructure, and industrial agglomeration.
Chapter 7: Site Evaluation Matrix
Ideal sites (score 4–5) meet all criteria: industrial zone, special high-voltage power already connected, fiber trunk within 500m, industrial water supply available, and within a GX Strategic Zone. These sites can achieve investment payback in 7–10 years. Standard sites (score 3) require ¥500 million–1.5 billion in additional infrastructure and extend payback to 10–15 years. Difficult sites (score 1–2) should defer conversion until BESS subsidy periods expire.
Chapter 8: Corrected Revenue Model for "Compute + Storage" Hybrid Configuration
Important Note: This chapter recalculates revenue using April 2026 market data, correcting figures from earlier analyses that used 2023 GPU shortage peak pricing.
8.1 GPU Rental Revenue: Market Rates Have Fallen Sharply (Dual-Scenario Analysis)
Global H100 supply has expanded significantly in 2026. According to the SemiAnalysis H100 Rental Index, 1-year contract pricing averaged approximately $2.35/hour in March 2026. With a 20–30% premium for the Japanese domestic market, this section presents a parallel analysis of two deployment configurations within the 2MW power capacity constraint.
Scenario A: GPU Training Configuration (H100 × 300 units)
The training configuration uses high-density racks (40 kW/rack), with each H100 consuming approximately 700W. Rental rates are estimated at ¥300,000–400,000/GPU/month (versus the ¥500,000–800,000 assumed in some earlier analyses).
| Item | Value | Notes |
|---|---|---|
| GPU Count | 300 H100 units | Training config, 40 kW/rack, ~38 racks |
| Monthly rental rate | ¥300,000–400,000/unit | Japan market, March 2026 |
| Monthly rental income (mid) | ¥10.5 million/month | 300 units × ¥350,000 |
| Annual rental income | ¥1.26 billion | At 100% utilization |
| Annual electricity cost | ~¥460 million | 300 × 700W × 8,760h × ¥25/kWh |
| Utilization adjustment | 80% | Training demand relatively stable |
| Net annual revenue | ¥550–850 million | After electricity, 70–90% utilization range |
Scenario B: GPU Inference Configuration (H100 × 600 units)
The inference configuration uses lower-density racks (20 kW/rack), with each H100 consuming approximately 350–400W during inference workloads. 600 units require approximately 240 kW IT load (approximately 312 kW including PUE 1.3), remaining within the 2MW power capacity. Rental rates are lower than training configurations at an estimated ¥200,000–300,000/GPU/month, but the doubled unit count maintains competitive total revenue.
| Item | Value | Notes |
|---|---|---|
| GPU Count | 600 H100 units | Inference config, 20 kW/rack, ~77 racks |
| Monthly rental rate | ¥200,000–300,000/unit | ~25–30% below training rates |
| Monthly rental income (mid) | ¥15 million/month | 600 units × ¥250,000 |
| Annual rental income | ¥1.8 billion | At 100% utilization |
| Annual electricity cost | ~¥530 million | 600 × 400W × 8,760h × ¥25/kWh |
| Utilization adjustment | 65% | Inference demand more variable |
| Net annual revenue | ¥600–800 million | After electricity, 55–75% utilization range |
Dual-Scenario Comparison
| Comparison Item | Scenario A: Training 300 units | Scenario B: Inference 600 units |
|---|---|---|
| GPU Count | 300 units | 600 units |
| Monthly rental rate | ¥300,000–400,000/unit | ¥200,000–300,000/unit |
| Annual electricity cost | ~¥460 million | ~¥530 million |
| Utilization assumption | 80% | 65% |
| Net annual revenue | ¥550–850 million | ¥600–800 million |
| Key advantage | Higher unit price, stable utilization | More units, broader market demand |
| Key risk | H100 training market competition | Inference market rate compression |
Both scenarios yield net annual revenue in the ¥550–850 million range, with limited overall difference. However, the risk profiles differ significantly. The training configuration relies on long-term contracts with a small number of large clients, offering stable utilization but high customer concentration risk. The inference configuration has broader customer distribution and demand, but faces greater downward pressure on rental rates. Operators should select their deployment strategy based on their customer development capabilities and risk tolerance.
8.2 Capacity Market Revenue: Reasonable but Constrained by BESS Retention
The FY2028 capacity market clearing price is ¥11,134/kW/year (announced January 2025). Retaining 500–1,000 kW of BESS generates approximately ¥56–110 million/year. Note that the upper bound of ¥150 million cited in some analyses requires retaining a large BESS capacity share that conflicts with the power demands of the compute center.
8.3 Tertiary Balancing Power ② Revenue: Structural Market Collapse
This is the item requiring the most significant correction. EPRX H1 FY2025 data shows the average clearing price for tertiary balancing power ② at approximately ¥1/ΔkW per 30-minute period—down from ¥5–20 before METI introduced the procurement volume reduction coefficient in 2024. For 500 ΔkW of available capacity, annual revenue is approximately ¥9 million (versus the ¥30–80 million cited in some earlier analyses).
8.4 Corrected Revenue Summary
| Revenue Source | Earlier Estimate | Corrected Estimate (2026 Market) | Key Correction |
|---|---|---|---|
| GPU rental (Scenario A: Training 300 units, net of electricity) | ¥1.8–3.0B | ¥0.55–0.85B | ¥300–400K/unit/month × 80% utilization |
| GPU rental (Scenario B: Inference 600 units, net of electricity) | — | ¥0.60–0.80B | ¥200–300K/unit/month × 65% utilization |
| Capacity market (BESS 500–1,000 kW) | ¥0.05–0.15B | ¥0.056–0.11B | Broadly reasonable, upper bound adjusted |
| Tertiary balancing power ② | ¥0.03–0.08B | ¥0.005–0.015B | Price collapse to ¥1/ΔkW after procurement cap |
| Renewable energy sales | ¥0.02–0.05B | ¥0.005–0.02B | Conservative estimate pending co-location scale |
| Total (Scenario A) | ¥1.9–3.3B/year | ¥0.57–0.90B/year | Training 300 units baseline |
| Total (Scenario B) | — | ¥0.62–0.84B/year | Inference 600 units baseline |
8.5 Corrected Investment Payback Period
With GX-subsidized capital cost of ¥5–7 billion, Scenario A (annual revenue ¥570–900 million) yields a payback period of 6–12 years, while Scenario B (annual revenue ¥620–840 million) yields a slightly shorter 6–11 years—both extended from the 3–5 years cited in earlier analyses. Both scenarios remain better than pure BESS operations (10–15 years), but the advantage has narrowed considerably.
Chapter 9: Key Risk Factors
Risk 1: GPU market competition intensifying. The launch of B200/GB300 next-generation GPUs will further compress H100 rental rates, potentially falling to ¥150,000–200,000/GPU/month by 2027.
Risk 2: Structural collapse of tertiary balancing power ② market. METI's procurement volume reduction coefficient has driven prices from ¥5–20 to ¥1/ΔkW, with no near-term recovery expected.
Risk 3: Electricity costs underestimated. GPU compute center electricity costs (approximately ¥460–600 million/year) are a critical cost item that must be explicitly included in financial models.
Risk 4: Overly optimistic utilization assumptions. Actual GPU rental market utilization rates are typically 60–80%, not 100%.
Risk 5: GX subsidy competition. The maximum 50% subsidy rate requires passing competitive review; not all applicants will receive the maximum rate, and financial models should evaluate scenarios without subsidies.
Conclusion
Converting Japan's 2MW BESS sites to GPU compute data centers remains a viable strategic transformation under the right conditions. The core advantage—that power infrastructure is already in place—remains intact, and METI's GX subsidy policy (up to 50% capital subsidy) provides strong policy tailwinds.
However, investment decisions must be based on 2026 market realities, not 2023 GPU shortage peak assumptions. Whether adopting the training configuration (300 units, ¥570–900 million/year) or inference configuration (600 units, ¥620–840 million/year), the corrected payback period of 6–12 years still represents an attractive proposition compared to pure BESS operations, but requires careful evaluation of electricity costs, GPU market competition trends, and the structural transformation of the balancing power market.
For operators holding BESS sites, now is an important time to assess conversion feasibility—the policy subsidy window is open and GPU compute demand remains strong, but market competition is intensifying rapidly, and early movers still hold a first-mover advantage.