1. The Dual Role of Battery Storage: kW Obligations and kWh Constraints
Battery energy storage systems (BESS) face a fundamental challenge that thermal power sources do not: they must simultaneously manage both the kW dimension (output power capability) and the kWh dimension (stored energy capacity). This dual constraint is the core starting point for BESS SOC management strategy.
Thermal power sources only need to consider the kW dimension — as long as fuel is available, they can generate up to their rated output at any time. But BESS is different: even if output power is sufficient, if the SOC (State of Charge) is too low, sustained supply is impossible. Therefore, fulfilling capacity market obligations for BESS is not just about "can it provide the specified output during supply shortfalls," but also "can it sustain that output for 3 or more hours."
1.1 Basic Capacity Market Requirements for Battery Storage
Under OCCTO's capacity market rules, battery storage (Pure Pumped Hydro & Battery Storage Group) expected capacity is calculated as follows:
- Discharge duration requirement: 3 hours or more (months with less than 3 hours result in proportionally reduced expected capacity)
- Expected capacity calculation: Transmittable power × adjustment coefficient (monthly minimum)
- Management capacity deduction: Monthly management capacity (for charge/discharge management) is deducted
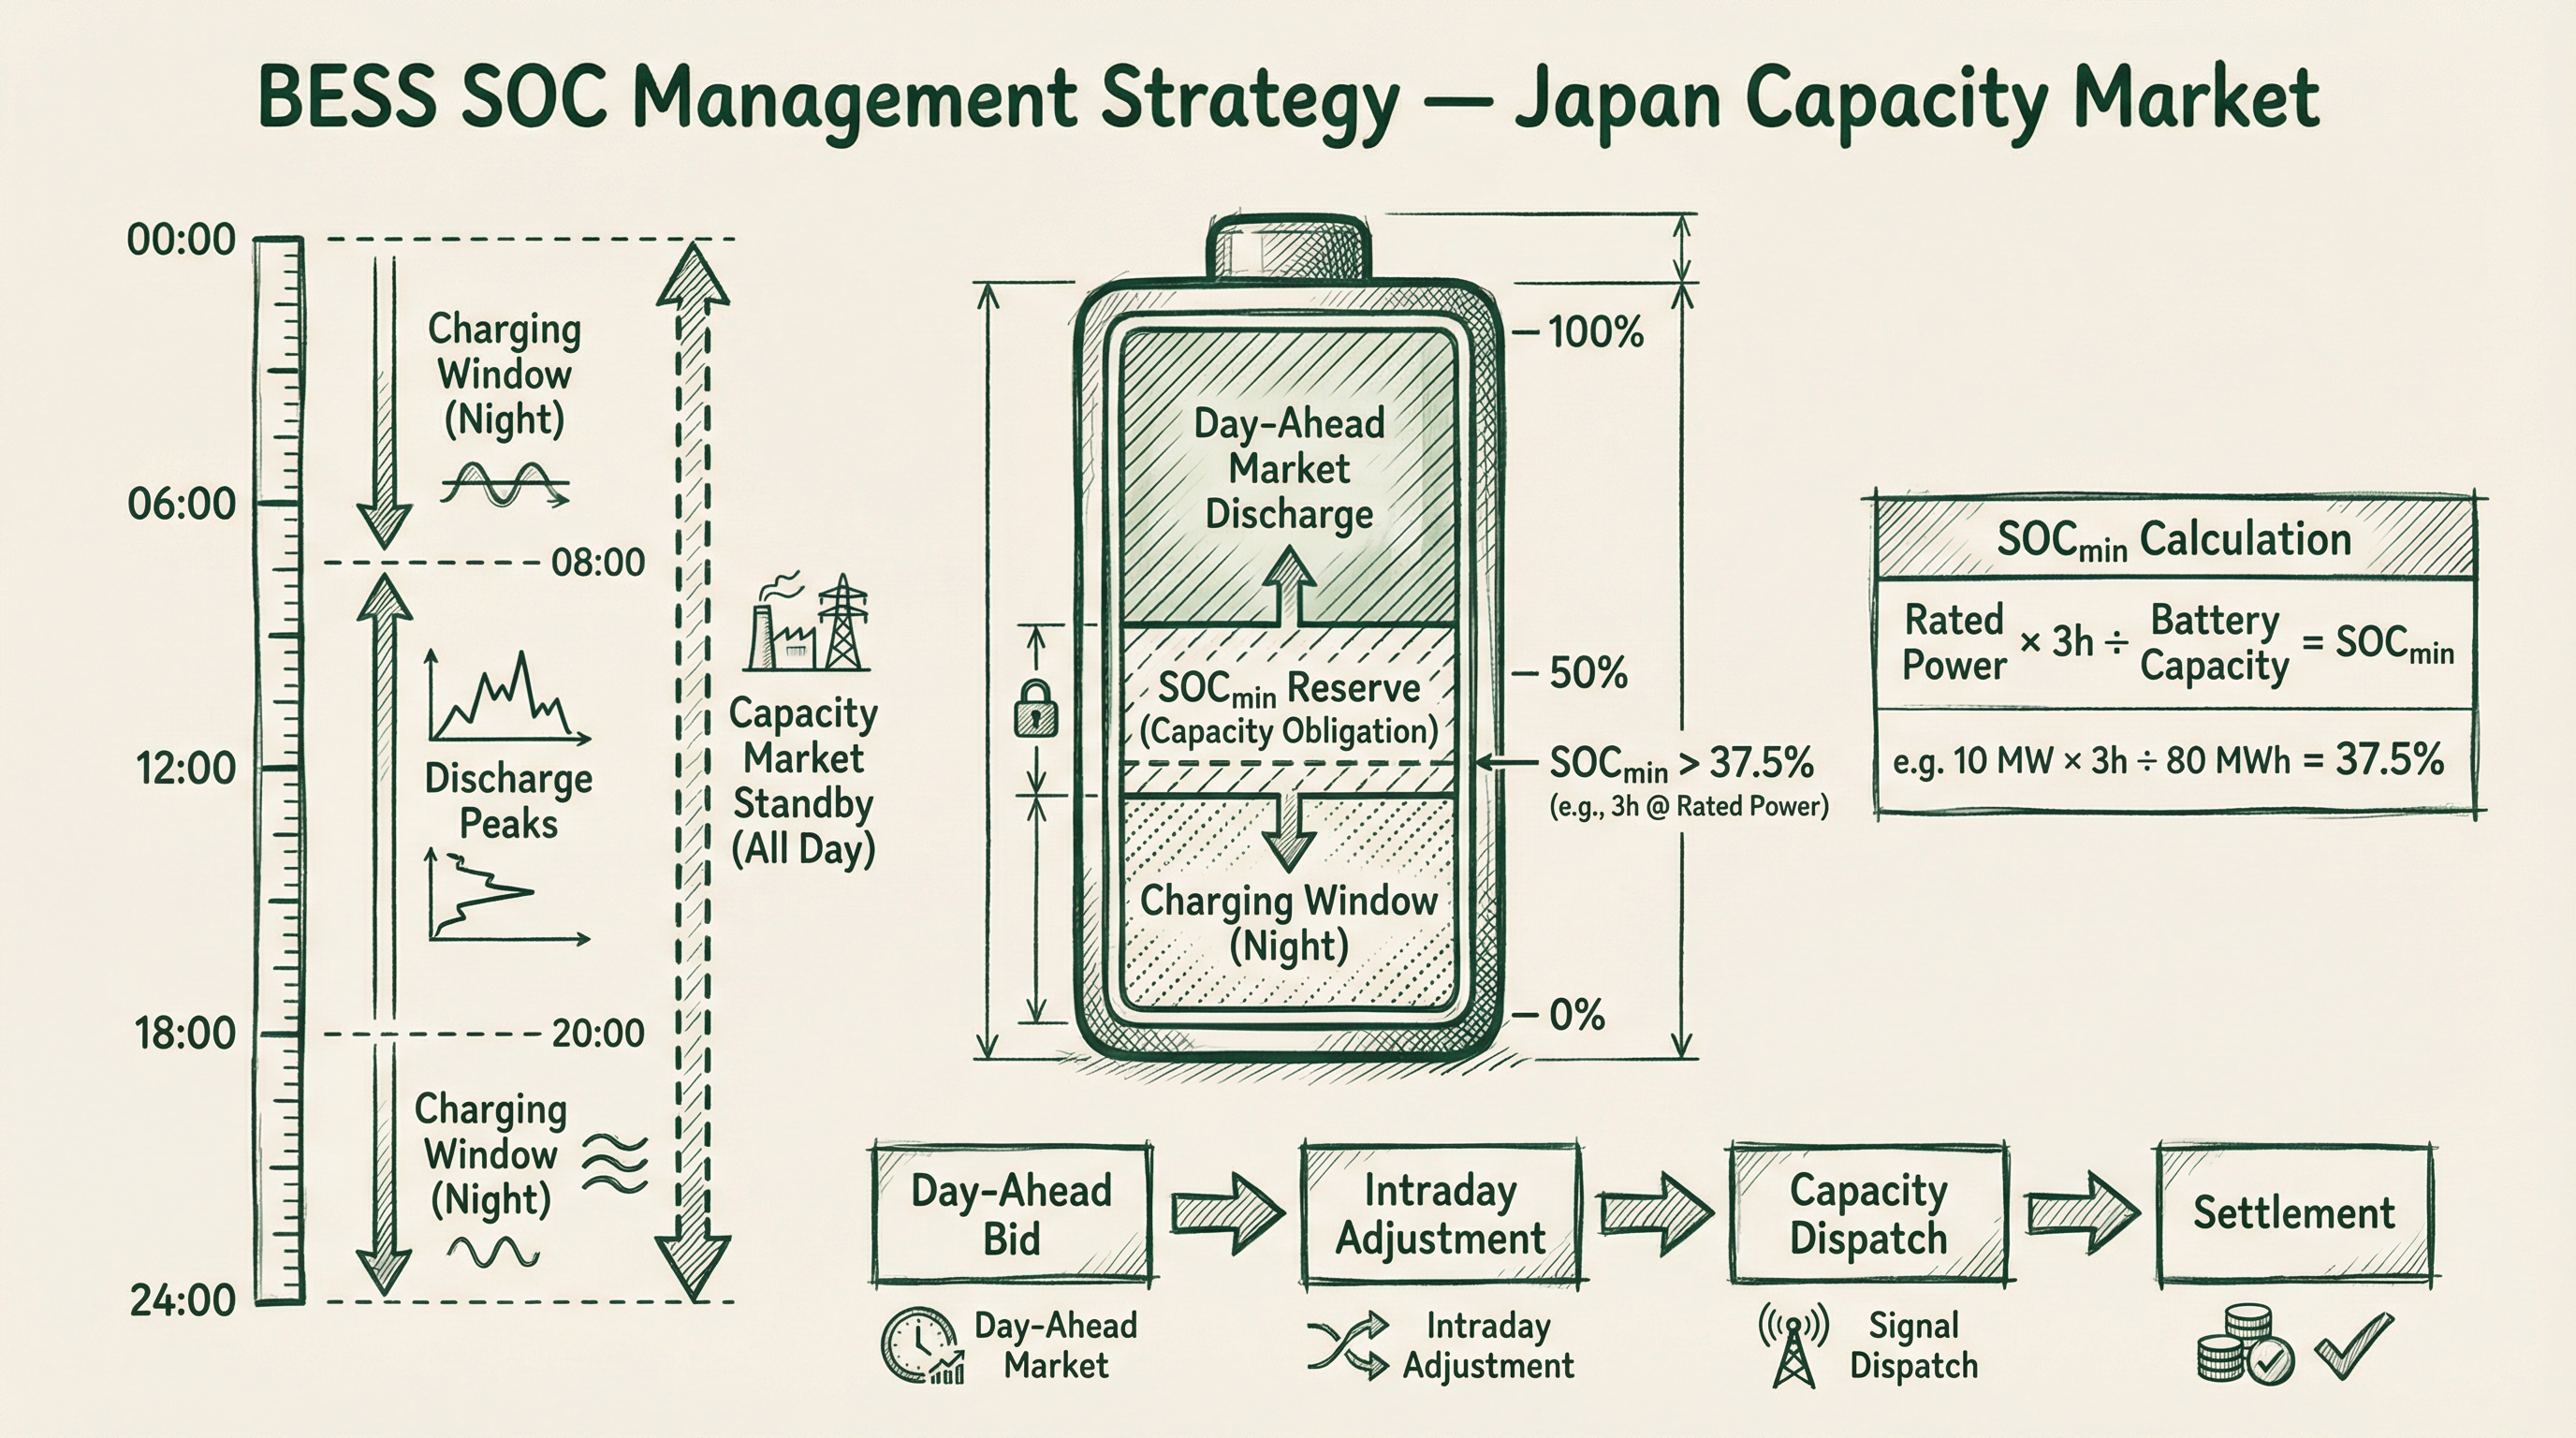
This means that if the capacity market registered capacity is P_cap (MW), the BESS must always maintain at least SOC_min = P_cap × 3h (MWh) to ensure it can discharge at P_cap for 3 hours during supply shortfalls.
1.2 SOC_min Calculation Framework
Let the battery's rated capacity be E_total (MWh) and the capacity market registered capacity be P_cap (MW):
- SOC_min (absolute) = P_cap × 3 (MWh)
- SOC_min (percentage) = (P_cap × 3) ÷ E_total × 100%
- Available surplus SOC for market trading = E_total × (1 - SOC_min%) - management capacity
Numerical example: 80 MWh battery, 10 MW capacity market registration:
- SOC_min = 10 MW × 3h = 30 MWh (37.5%)
- Available surplus SOC = 80 MWh × (1 - 37.5%) - management capacity ≈ 50 MWh (after management capacity deduction)
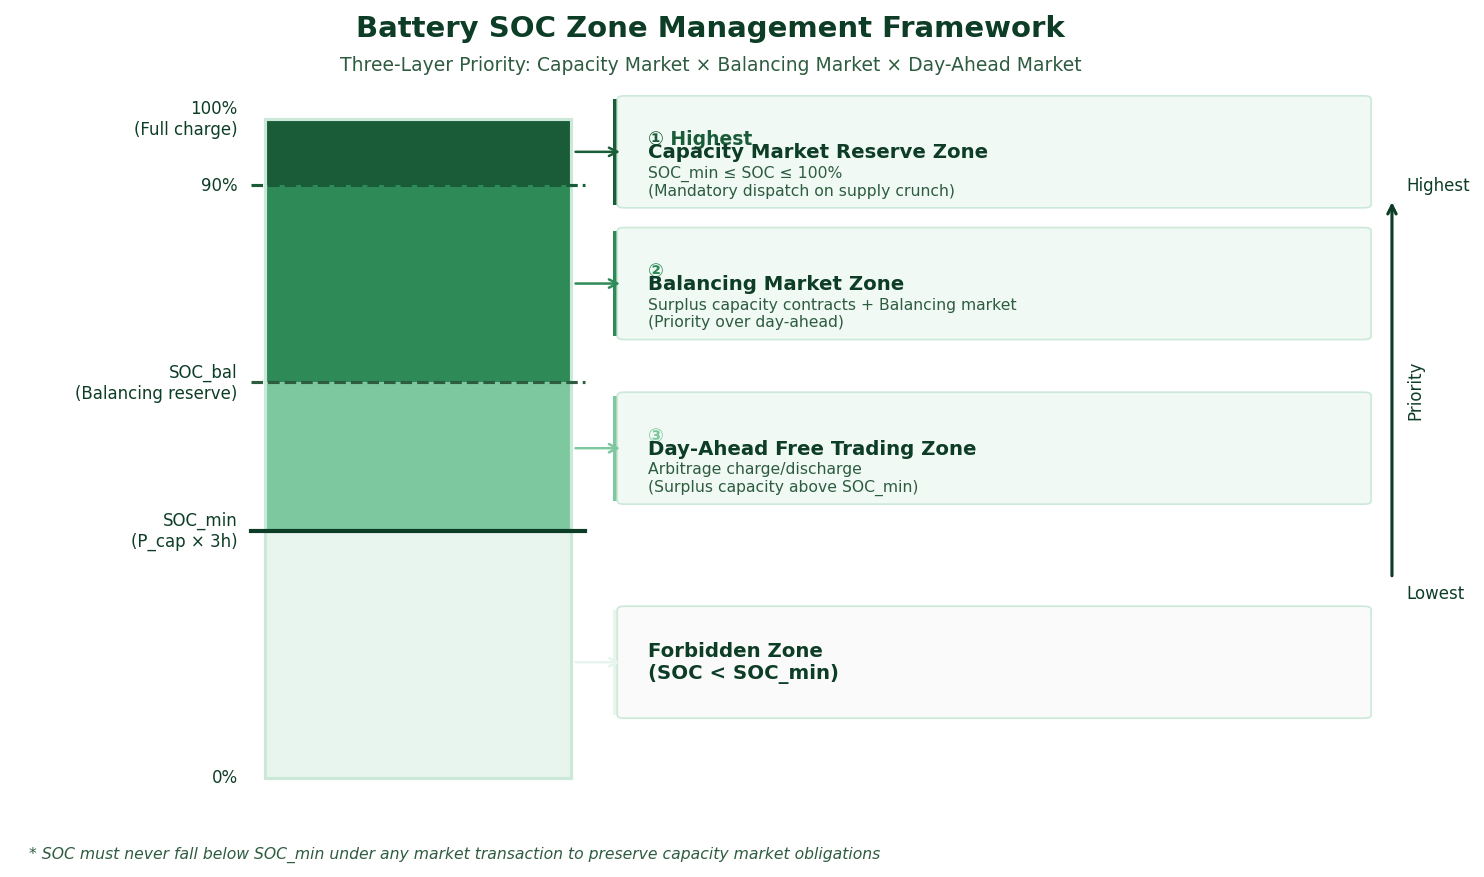
2. The Four-Layer Cross-Market SOC Management Framework
Battery storage faces simultaneous constraints from four markets in Japan's electricity market. SOC management must balance these four layers in priority order:
Layer 1: Capacity Market (kW Obligation)
The capacity market is the highest-priority obligation layer. When OCCTO issues a supply shortfall alert, the BESS must provide its registered capacity within 3 hours. Therefore, SOC_min is an inviolable floor — regardless of how high day-ahead or intraday market prices are, SOC must never be discharged below SOC_min.
Layer 2: Surplus Capacity Utilization Contracts (kWh Provision)
From FY2024, OCCTO introduced the "Surplus Capacity Utilization Contract" system, allowing transmission system operators (TSOs) to dispatch BESS as balancing resources within the surplus SOC above SOC_min. Contract compensation is settled on a kWh basis, providing an additional revenue stream beyond capacity market obligations.
Surplus capacity utilization contract instructions have lower priority than capacity market obligations but higher priority than free day-ahead market discharge plans. BESS operators must respond to surplus capacity utilization contract instructions within the SOC range above SOC_min.
Layer 3: Balancing Market (Balancing Capacity Provision)
BESS can also be simultaneously registered as balancing capacity in the balancing market (particularly Tertiary-2). However, Tertiary-2 balancing provision consumes kWh, so SOC management must reserve buffer space for balancing responses. After the April 2026 market reform, weekly advance procurement of balancing capacity changed to day-ahead procurement, allowing BESS operators to plan day-ahead market charge/discharge schedules after confirming balancing market clearing results the previous day.
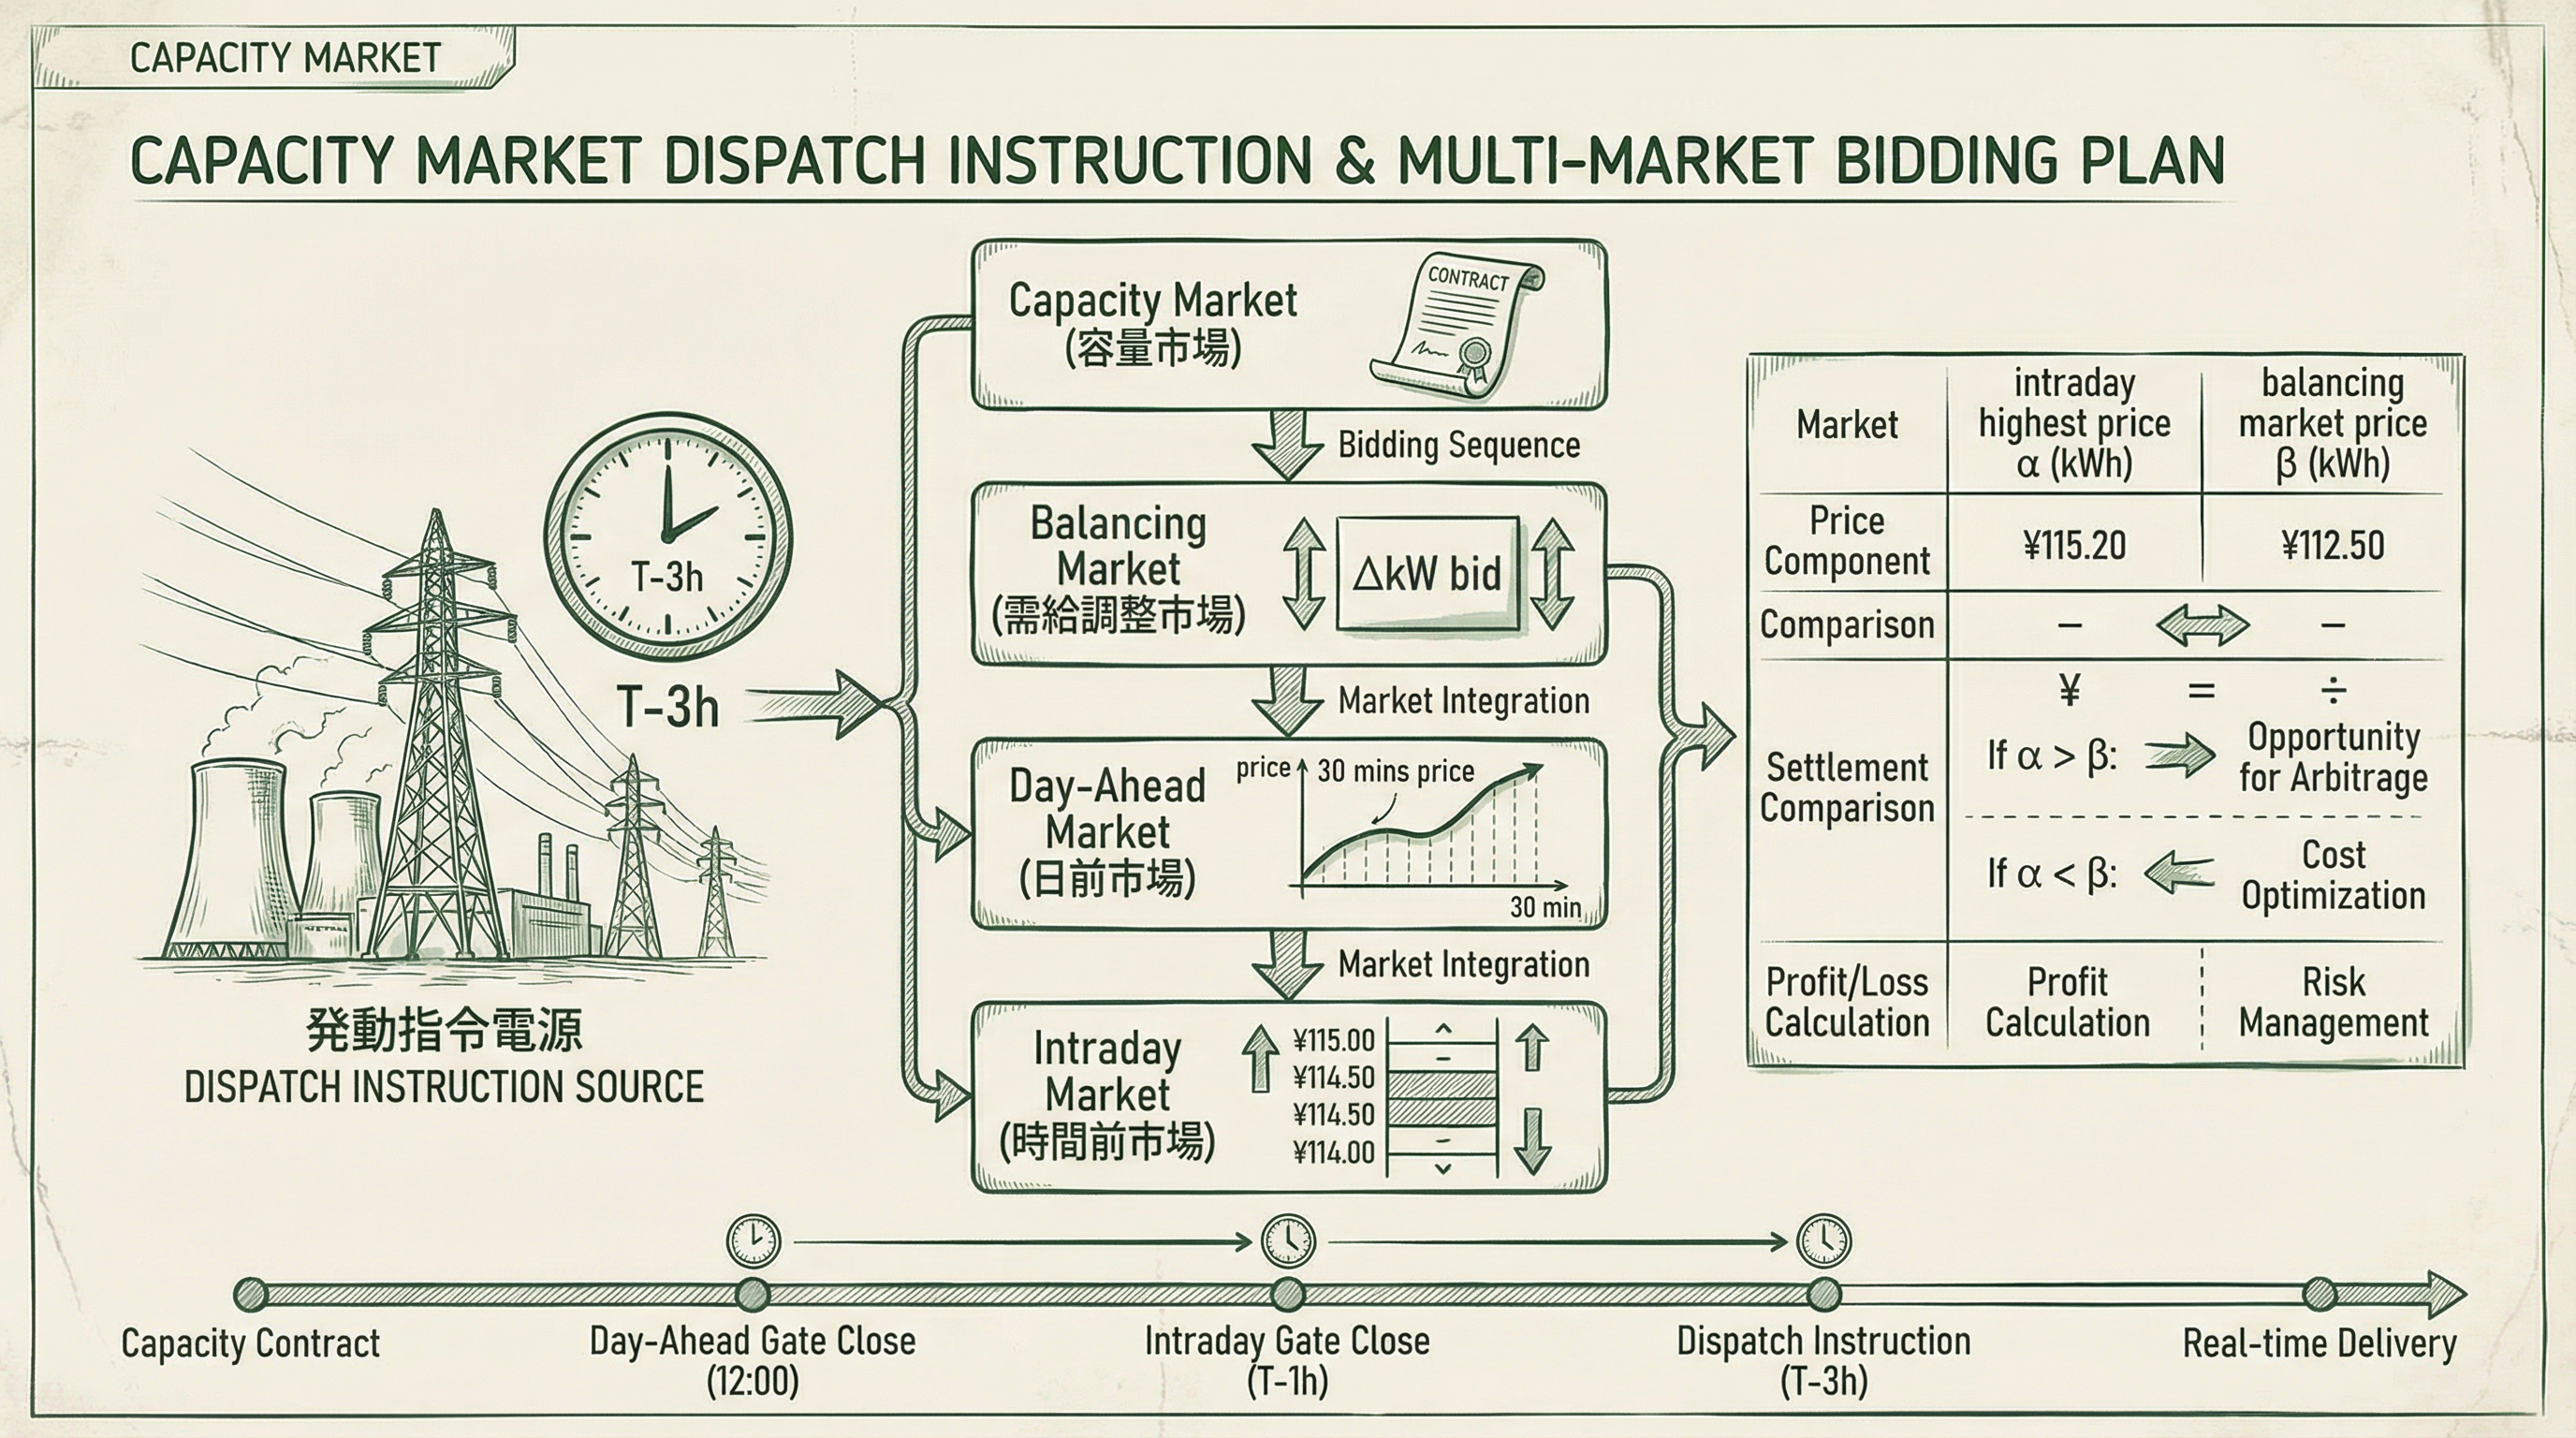
Layer 4: Day-Ahead and Intraday Markets (Free Charging/Discharging)
After satisfying the above three layers of constraints, the remaining surplus SOC can be used for free charge/discharge arbitrage in the day-ahead market (JEPX spot market) and intraday market. Charging concentrates in the low-price late-night period (00:00–06:00), while discharging concentrates in the high-price morning peak (08:00–10:00) and evening peak (17:00–20:00) periods.
2.5 Institutional Foundation: OCCTO's "Storage-Type Operation" Policy Framework
The institutional basis for the four-tier framework described above derives from the "Storage-Type Operation" policy framework proposed by OCCTO at its 105th Committee on Adjustment Capacity and Supply-Demand Balance Evaluation (January 28, 2025). The core of this framework is elevating TSO's visibility of BESS from the "kW level" to the "kWh level"—TSO obtains real-time data on BESS power output (kW) and available discharge kWh via dedicated online lines, enabling more precise cross-slot dispatch optimization.
This institutional design has direct implications for BESS operators' SOC management strategies. OCCTO explicitly states that "full charge maintenance" is not permitted as an exemption condition in surplus utilization contracts—operators must design SOC management strategies that accommodate TSO discharge commands at any time. This is the institutional basis for the priority design of "Tier 2: Surplus Utilization Contracts" in this article's four-tier framework. Storage-Type Operation applies to BESS of 10 MW or more with dedicated online line connections (Long-Term Decarbonization Auction or Capacity Market winners); other BESS of 10 MW or more are subject to individual negotiation. For detailed institutional analysis, see OCCTO BESS "Storage-Type Operation" Policy Analysis.
3. Optimal Registration Capacity Calculation Framework
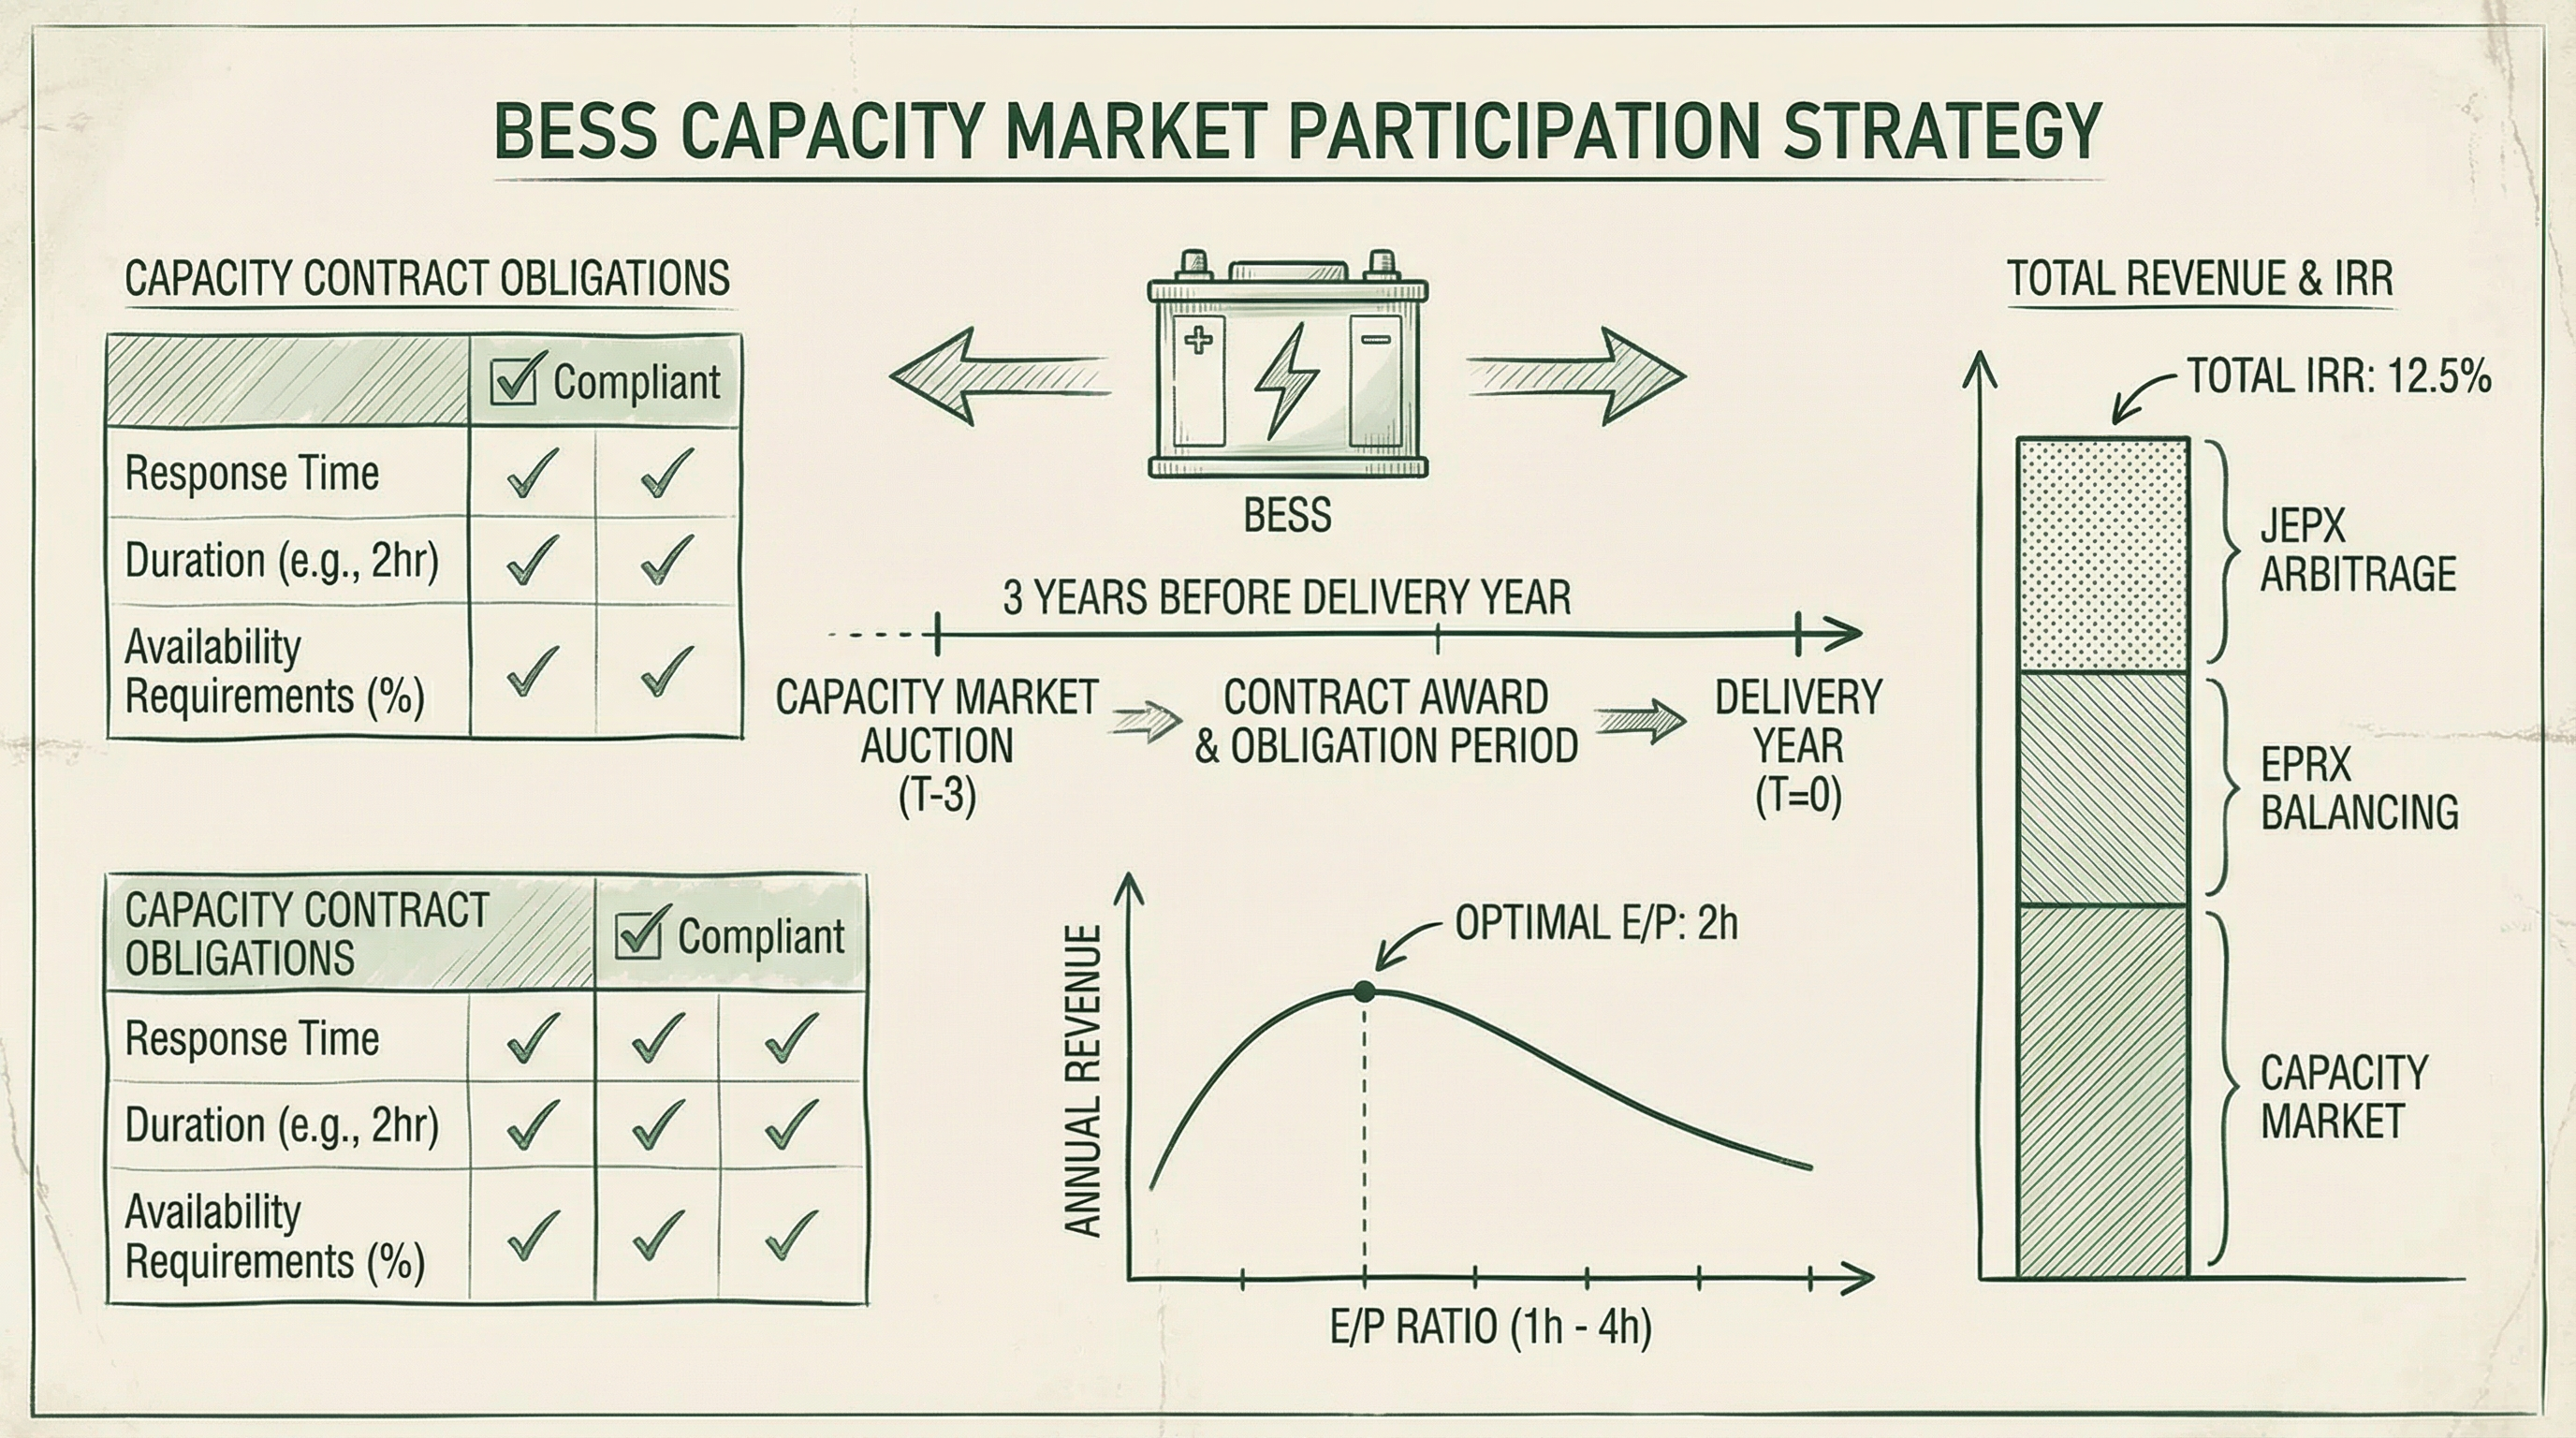
The choice of capacity market registration capacity (P_cap) is one of the most important strategic decisions for BESS operators. Too high a registration reduces day-ahead market operational flexibility; too low reduces kW revenue. The optimal registration capacity is determined at the equilibrium point between these two trade-offs.
3.1 Revenue Structure Analysis
| Revenue Source | Calculation Method | Relationship to Registration Capacity |
|---|---|---|
| Capacity market kW revenue | P_cap × contract unit price (¥/kW/year) | Proportional to registration capacity |
| Surplus capacity contract revenue | Surplus SOC × unit price (¥/kWh) | Inversely proportional |
| Day-ahead market arbitrage revenue | Surplus SOC × (peak price - valley price) | Inversely proportional |
| Balancing market revenue | Cleared volume × kW price + kWh settlement | Weakly inversely proportional (SOC-constrained) |
3.2 Marginal Condition for Optimal Registration Capacity
The optimal registration capacity P_cap* satisfies the following marginal condition:
Capacity market contract unit price = Day-ahead market arbitrage opportunity cost (arbitrage revenue lost by increasing registration by 1 MW)
Specific calculation:
- Increasing registration by 1 MW requires reserving an additional 3 MWh of SOC_min
- If this 3 MWh SOC were used for day-ahead market discharge, it would generate 3 MWh × (peak price - charging cost) in arbitrage revenue
- Therefore, optimal registration satisfies: contract unit price ≥ 3 × (peak price - charging cost)
3.3 Numerical Simulation Example
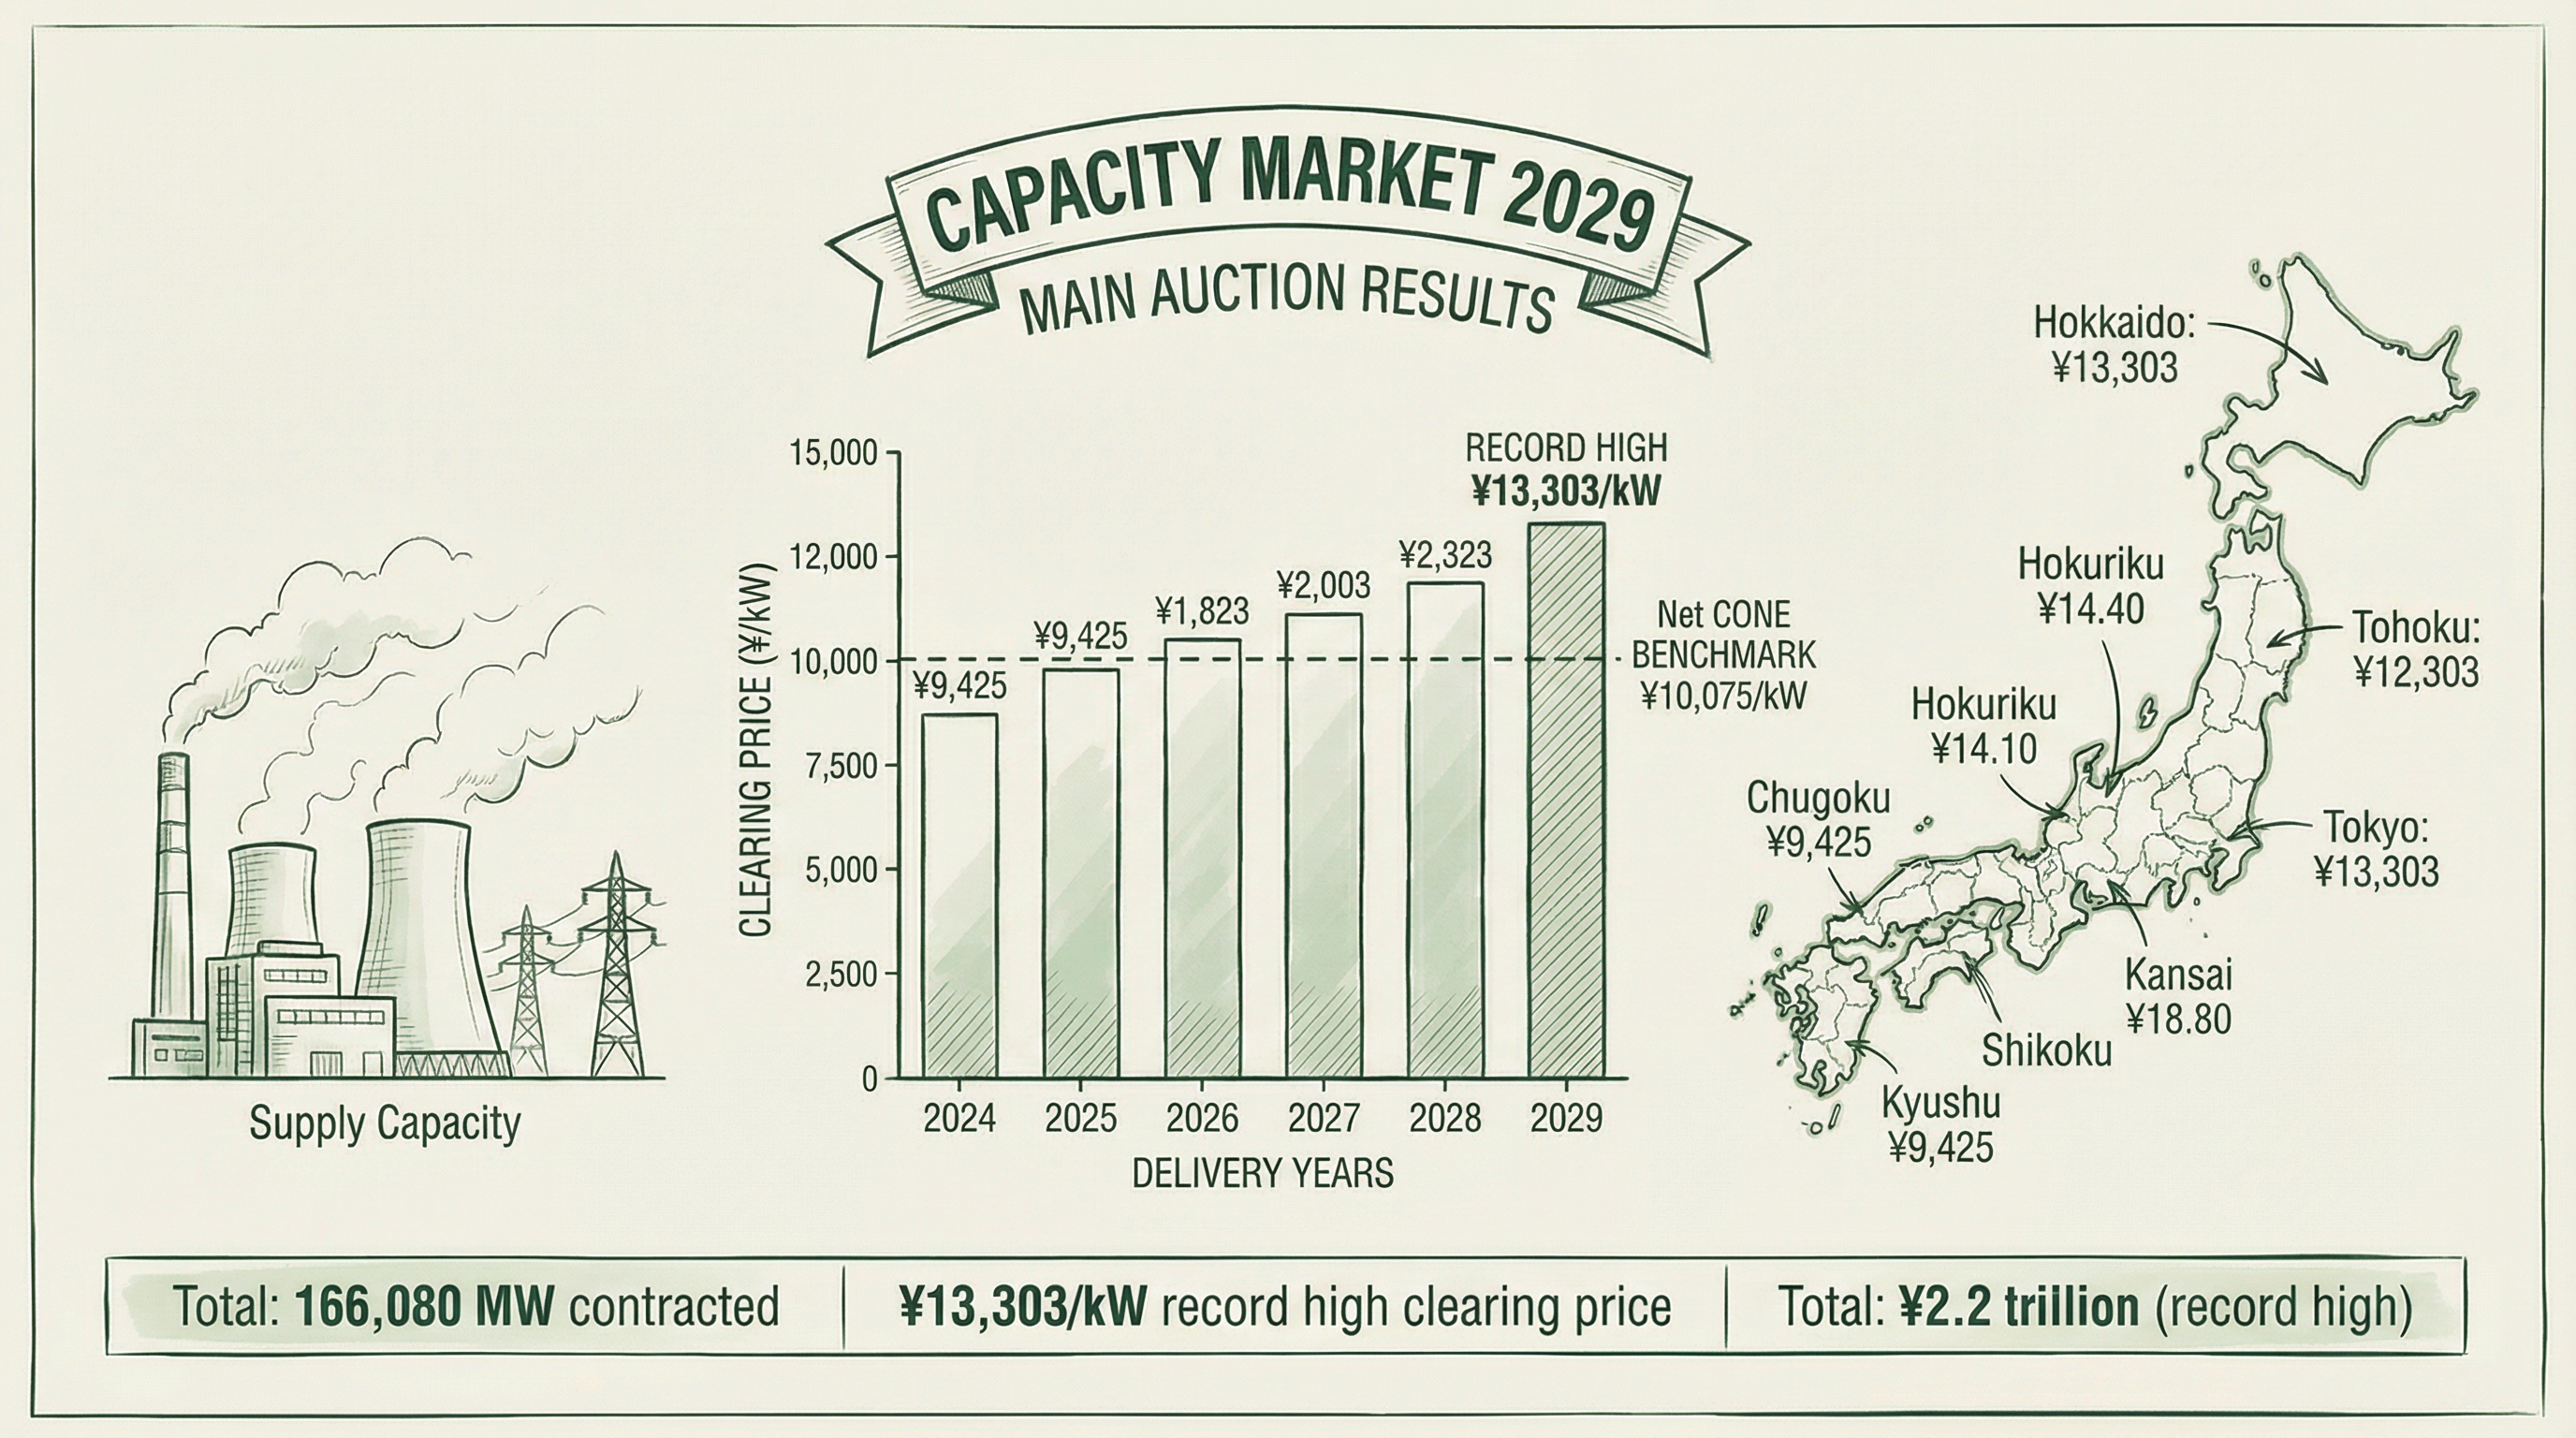
Assumptions: 100 MWh battery, capacity market contract unit price ¥13,000/kW/year, day-ahead market peak price ¥20/kWh, late-night charging cost ¥5/kWh, round-trip efficiency 90%:
- Day-ahead arbitrage opportunity cost (per MW registration) = 3 MWh × (¥20 - ¥5/0.9) × 365 days ≈ ¥9,800/kW/year
- Capacity market contract price ¥13,000 > opportunity cost ¥9,800 → should increase registration
- Optimal registration: approximately 25–30 MW at the marginal point (subject to seasonal peak price variation)
4. 24-Hour SOC Management Timeline
Below is a typical daily BESS SOC management timeline (assuming 20 MW capacity market registration, 100 MWh battery capacity):
| Time Period | SOC Target | Market Operation | Notes |
|---|---|---|---|
| 00:00–06:00 | 60% → 100% | Day-ahead market charging | Charge during low-price late-night window, target 100% |
| 06:00–08:00 | 100% → 80% | Intraday market fine-tuning | Confirm next-day supply shortfall forecast, adjust SOC_min reserve |
| 08:00–10:00 | 80% → 60% | Day-ahead market discharge (morning peak) | Discharge during morning peak high-price period, maintain SOC_min (60%) |
| 10:00–16:00 | 60% → 70% | Surplus capacity contract standby / intraday | Prioritize surplus capacity contract instructions; fine-tune in intraday market if no instructions |
| 16:00–17:00 | 70% → 80% | Intraday market charging | Replenish SOC before evening peak |
| 17:00–20:00 | 80% → 60% | Day-ahead market discharge (evening peak) | Discharge during evening peak high-price period, maintain SOC_min (60%) |
| 20:00–24:00 | 60% → 60% | Capacity market obligation standby | Maintain SOC_min, await next day's charging window |
Note: SOC_min = 20 MW × 3h ÷ 100 MWh = 60%. At no time should SOC fall below 60%, to ensure capacity market obligation fulfillment capability.
5. Surplus Capacity Utilization Contract SOC Integration
The surplus capacity utilization contract (from FY2024) is a new variable in BESS SOC management. TSOs can issue charge/discharge instructions to BESS operators within the surplus SOC above SOC_min, with compensation settled on a kWh basis.
5.1 SOC Priority Order for Surplus Capacity Contracts
Surplus capacity utilization contract instruction priority sits between capacity market obligations (highest) and free day-ahead market operations (lowest). Specific priority order:
- Capacity market supply obligation during supply shortfalls (SOC_min is inviolable)
- Surplus capacity utilization contract instructions (within surplus SOC above SOC_min)
- Balancing market balancing capacity instructions (Tertiary-2, etc.)
- Day-ahead market free charge/discharge plan
- Intraday market fine-tuning
5.2 Balancing Function Requirements for Surplus Capacity Contracts
Per OCCTO (January 2025), battery storage participating in surplus capacity utilization contracts as long-term decarbonization power auction winning sources must meet the following balancing function requirements:
| Item | BESS (incl. pumped hydro) | (Reference) Thermal power |
|---|---|---|
| Equipment capacity | 10 MW or more | 100 MW or more |
| Balancing functions | GF, LFC, EDC | GF, LFC, EDC |
| GF response time | Within 10 seconds | Within 10 seconds |
| GF dead band | ±0.01 Hz or less | ±0.01 Hz or less |
| GF droop rate | 5% or less | 5% or less |
| LFC delay time | Within 20 seconds | Within 20 seconds |
6. Charge/Discharge Cycle Management and Battery Degradation Costs
BESS SOC management must consider not only capacity market obligations and market arbitrage, but also battery degradation costs. Excessive charge/discharge cycles accelerate battery degradation, shorten battery life, and increase battery replacement costs.
6.1 Degradation Cost Calculation Framework
- Battery replacement cost: ¥50,000–80,000/kWh (2025 market price)
- Design charge/discharge cycle count: 4,000–6,000 cycles (LFP battery)
- Degradation cost per cycle = Battery replacement cost ÷ Design cycle count
- Example: ¥60,000/kWh ÷ 5,000 cycles = ¥12/kWh/cycle
When calculating day-ahead market arbitrage revenue, the degradation cost per charge/discharge must be deducted:
Net arbitrage revenue = (Peak discharge price - Valley charging cost ÷ round-trip efficiency) - Degradation cost × 2 (charging + discharging each count as 1 cycle)
7. Differences from Pure Pumped Hydro SOC Management
Pure pumped hydro (Pure Pumped Hydro Group) belongs to the same "Pure Pumped Hydro & Battery Storage Group" as BESS, with the same expected capacity calculation method, but SOC management (upper reservoir water level management) has the following fundamental differences:
| Comparison Item | Battery Storage | Pure Pumped Hydro |
|---|---|---|
| Physical form of "SOC" | Electrochemical energy (MWh) | Upper reservoir water level (m) / stored water volume (MWh) |
| Charging efficiency | 90–95% (round-trip) | 70–75% (pumping efficiency) |
| Charging cost | JEPX market electricity purchase cost | JEPX market electricity purchase cost ÷ pumping efficiency |
| Capacity constraint | Battery capacity limit (fixed) | Upper reservoir capacity (fixed) + natural inflow (seasonal variation) |
| Degradation | Cycle-induced degradation | Mechanical wear (no cycle degradation) |
| Seasonality | Minimal | Snowmelt season (Mar–May) natural inflow increase; drought risk (summer) |
7.1 Pure Pumped Hydro Effective Charging Cost
Pure pumped hydro effective charging cost must account for pumping efficiency:
- Pumping efficiency (η): Typically 70–75% (100 kWh pumped → 70–75 kWh generated)
- Effective charging cost = Charging power × JEPX night price ÷ pumping efficiency
- Example: Night JEPX price ¥5/kWh, pumping efficiency 70% → Effective charging cost = ¥5 ÷ 0.7 = ¥7.14/kWh
This means pure pumped hydro has a higher arbitrage threshold than BESS: peak discharge prices must exceed ¥7.14/kWh for positive arbitrage (BESS threshold is approximately ¥5.56/kWh assuming 90% round-trip efficiency).
References
- METI: Treatment of Special Resources (Large-scale Pumped Hydro and Battery Storage) in Simultaneous Market (April 2025)
- OCCTO: Future Operation of Battery Storage Surplus Capacity Utilization Contracts (January 2025)
- OCCTO: Expected Capacity Calculation Reference Form 2 — Pure Pumped Hydro & Battery Storage Group (FY2028)
- Borderless Law: Japan Battery Storage Investment Guide 2025