📌 Article Context
This article is the practical companion to Article 11 (Imbalance Fee Unit Price), focusing on how retail electricity providers can systematically reduce imbalance fee costs under the 2026 reformed system.
I. Cost Pressures After the 2026 Reform
In April 2026, the C-value in Japan's imbalance fee system was raised from ¥200/kWh to ¥300/kWh, increasing the maximum potential penalty cost per kWh during supply-tight periods by 50%. For small retail electricity providers and renewable energy generators with lower supply-demand planning accuracy, this change creates significant financial pressure.
According to data from Japan's Electricity and Gas Market Surveillance Commission, the total imbalance fees paid nationwide in fiscal 2025 exceeded ¥300 billion, with approximately 40% concentrated in summer (July–September) and winter (December–February) peak periods. Following the C-value increase, this figure is expected to rise further, making supply-demand management capability a direct determinant of business survival.
Risk Exposure by Participant Type
| Participant Type | Primary Risk Factors | Imbalance Fee Impact | Priority Measures |
|---|
| Small Retail Providers | Low forecast accuracy, insufficient adjustment resources | High (financial crisis risk) | AI forecasting, intraday market utilization |
| Solar PV Generators | Weather uncertainty, output forecast errors | Medium-High (weather-dependent) | Weather data integration, battery storage |
| Wind Power Generators | Wind speed forecasting difficulty, typhoon shutdowns | High (extreme during typhoons) | Multi-site diversification, insurance |
| Large Integrated Utilities | Wide-area adjustment complexity | Low (sufficient own adjustment capacity) | Optimized dispatch systems |
| Mid-Size New Entrants | Demand portfolio diversity management | Medium (partially buffered by scale) | Portfolio optimization, DR utilization |
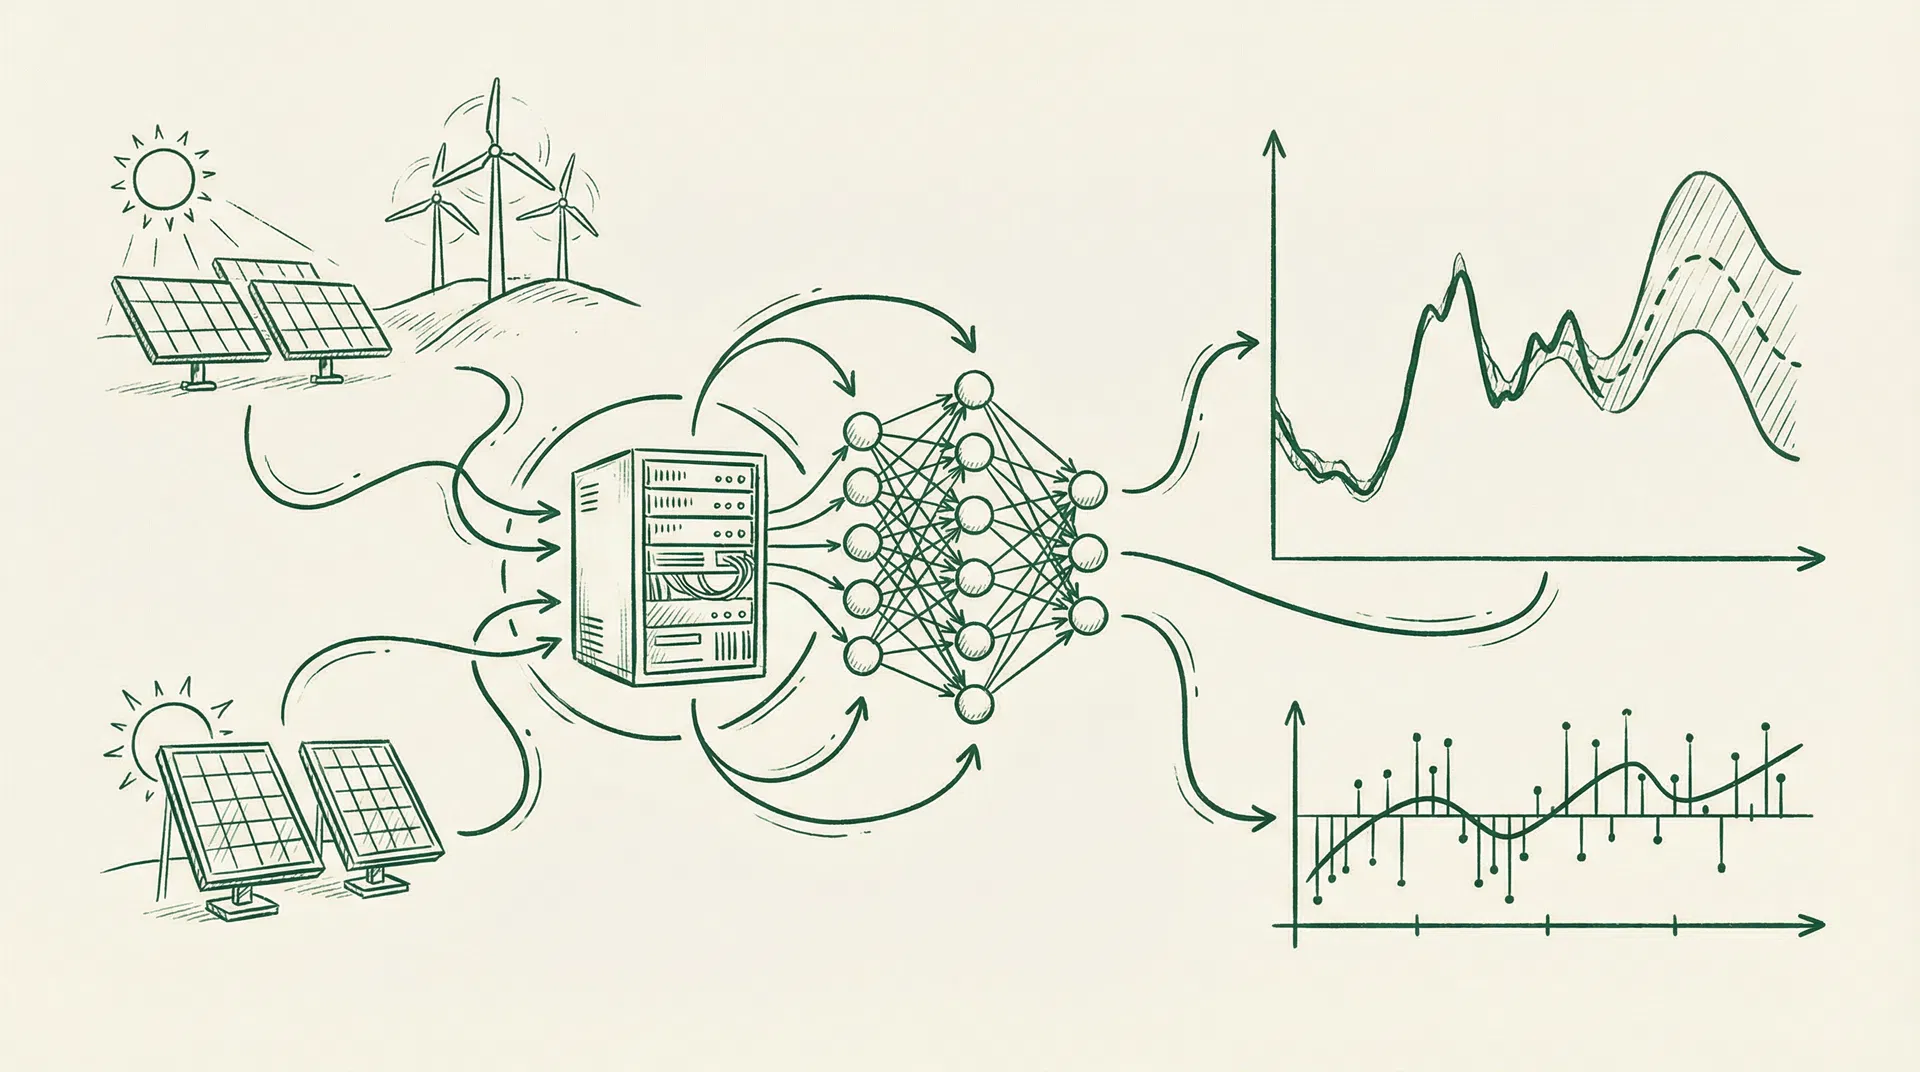
II. Practical Implementation of AI Demand Forecasting
Improving supply-demand planning accuracy is the first line of defense against imbalance fees. Traditional statistical regression models often struggle with complex weather-demand relationships, while modern AI and machine learning methods can substantially improve forecast accuracy across multiple dimensions.
Comparison of Major AI Forecasting Technologies
| Technology | Best Use Case | Accuracy Improvement | Implementation Difficulty |
|---|
| LSTM (Long Short-Term Memory) | Time-series demand, seasonal pattern capture | MAPE reduction 15–25% | Medium (requires GPU resources) |
| Gradient Boosting (XGBoost/LightGBM) | Feature-rich short-term forecasting | MAPE reduction 10–20% | Low (easy to deploy) |
| Transformer Models | Long-range dependencies, multivariate forecasting | MAPE reduction 20–35% | High (requires large training datasets) |
| Hybrid Models (Statistical + ML) | SMEs with limited historical data | MAPE reduction 8–15% | Low-Medium (incremental adoption) |
Key Input Feature Engineering
High-Impact Feature Categories
Weather Features
- Temperature (actual + 72-hour forecast)
- Solar irradiance (essential for PV generators)
- Wind speed and direction (wind generators)
- Humidity, cloud cover
- Apparent temperature (HVAC demand proxy)
Temporal Features
- Day of week and holiday flags
- Time slot (30-minute interval number)
- Season and month
- Pre/post-holiday effects
- Major event calendar
Demand-Side Features
- Historical actuals for same slot (7/14/28 days prior)
- Customer industry portfolio
- Factory operating calendar
- EV charging demand estimates
Market Features
- JEPX day-ahead spot prices
- Wide-area reserve margin forecasts
- Supply-demand tightness alert status
- Renewable energy output forecasts
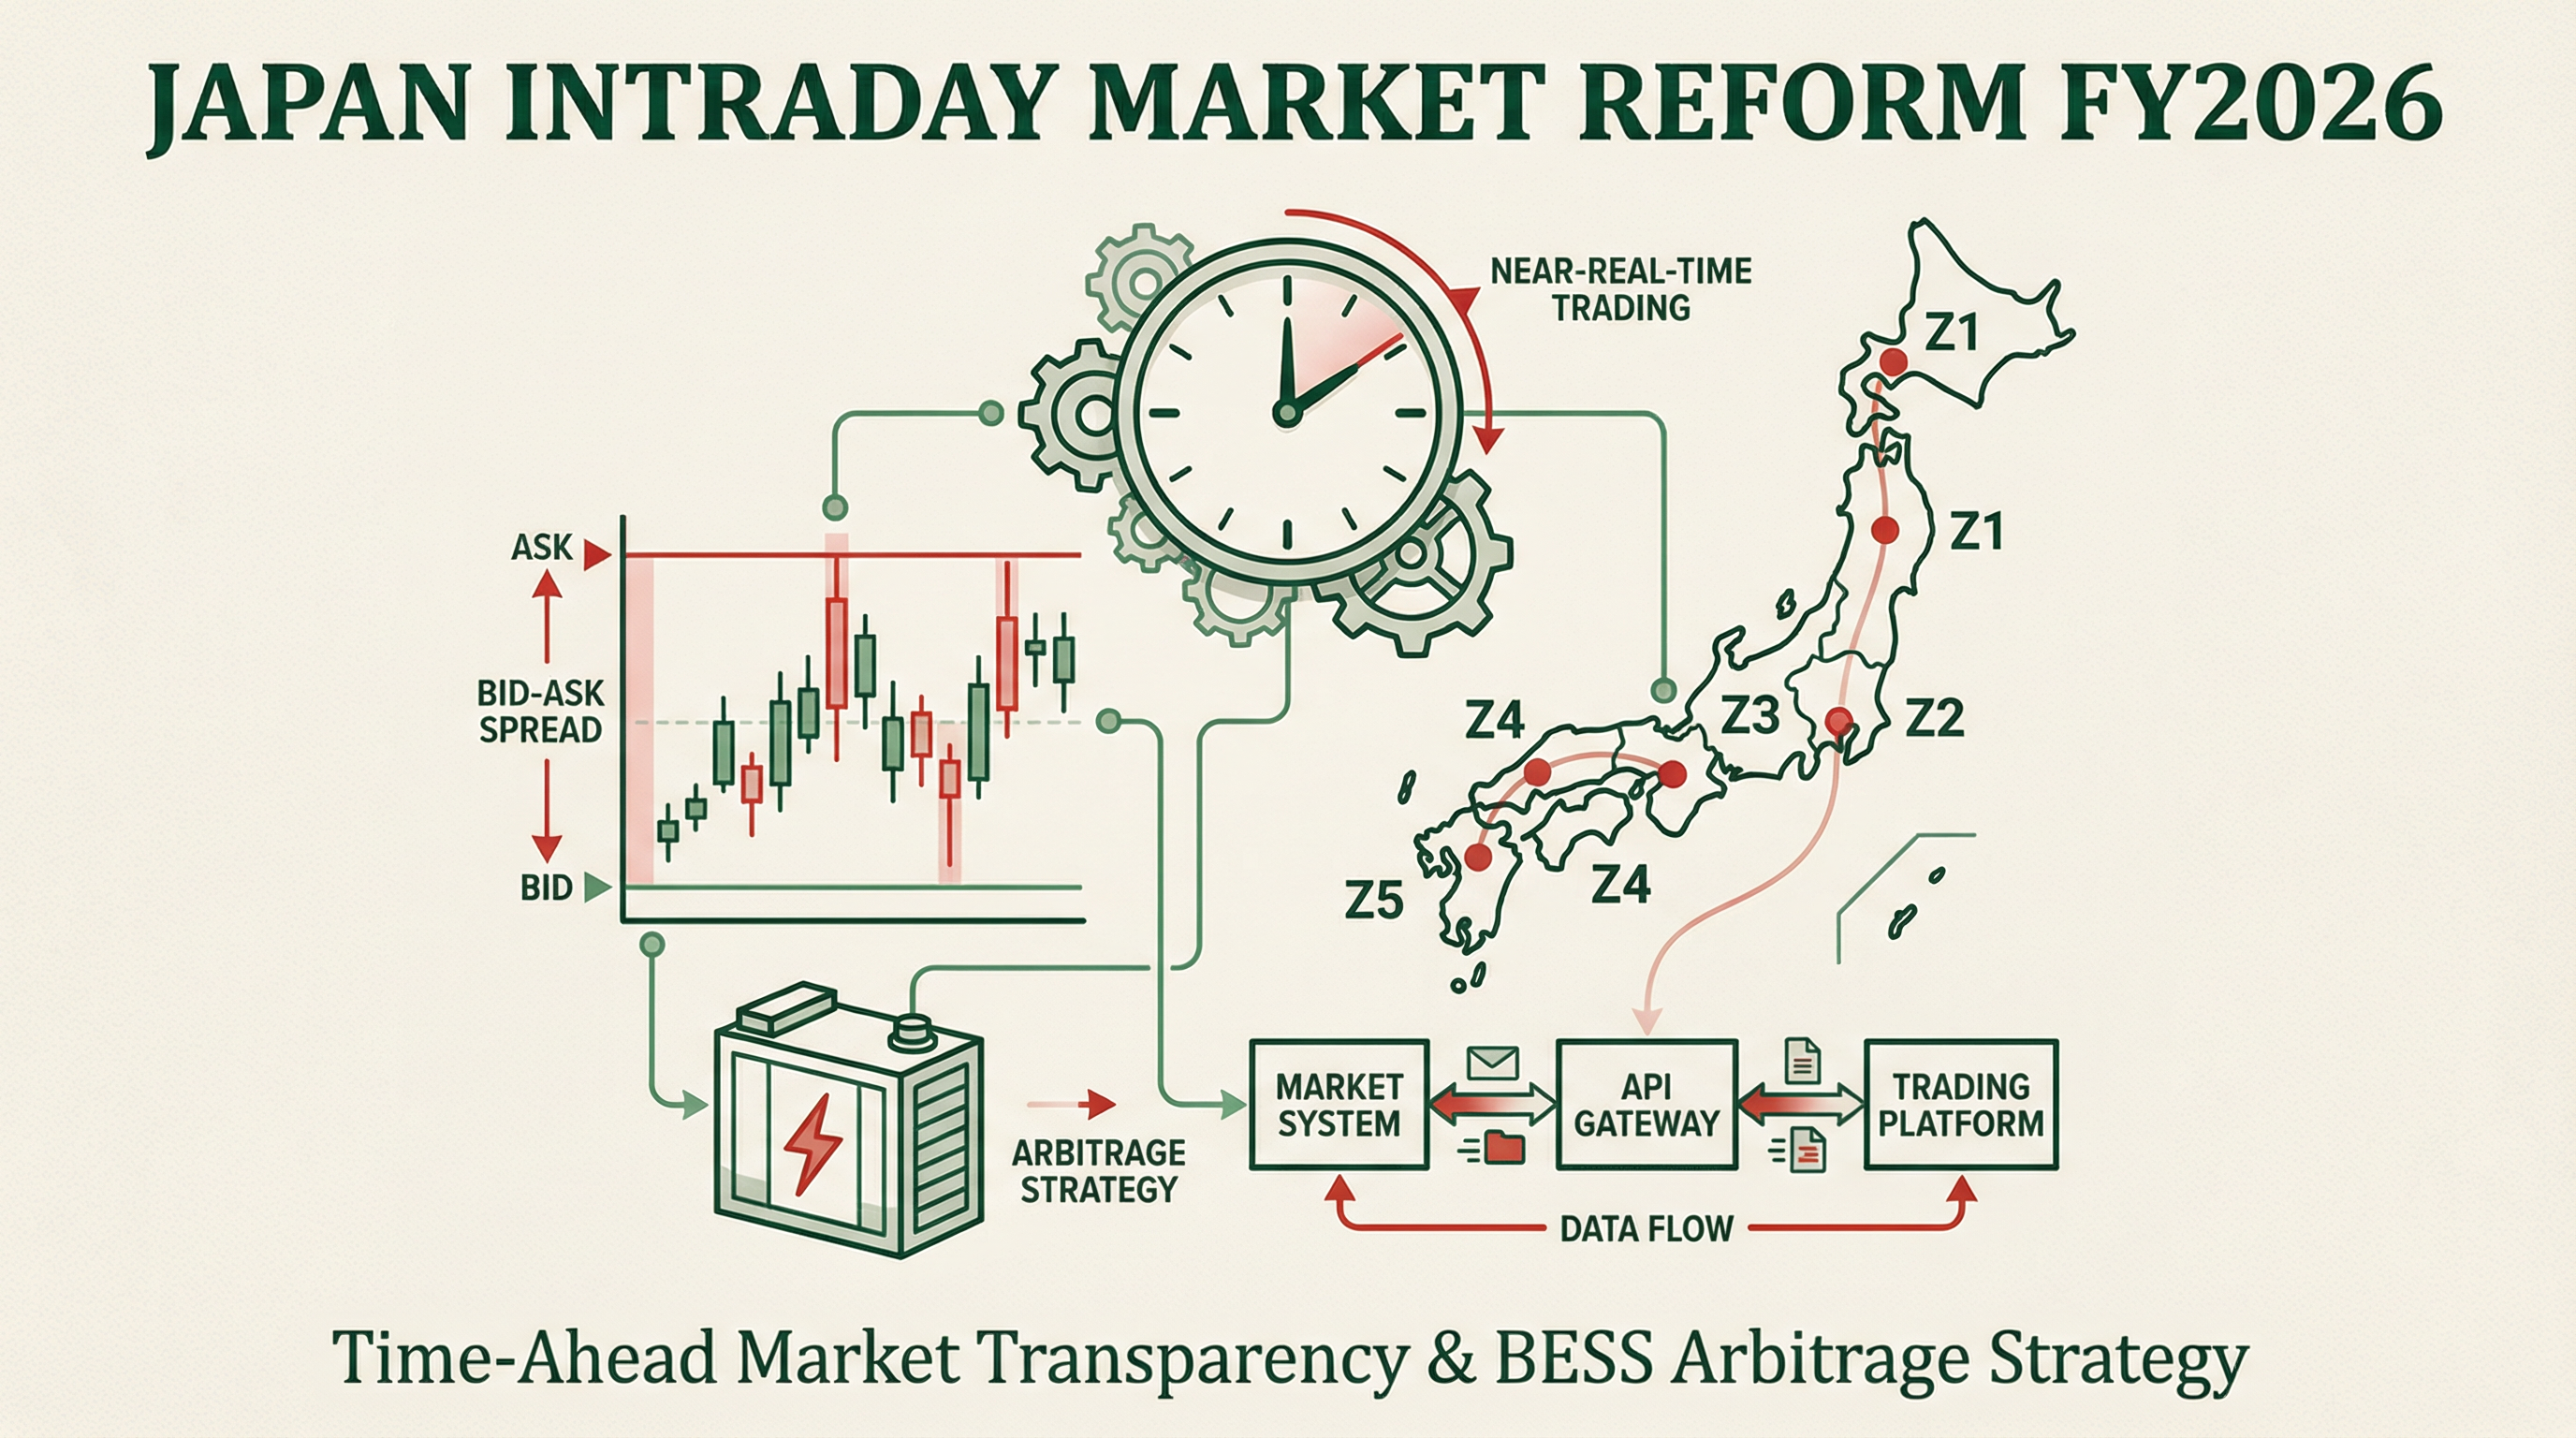
III. Optimal Utilization of the Intraday Market
The intraday market (1-hour-ahead market) is the electricity trading market conducted approximately one hour before actual delivery, after spot market settlement. For participants with limited planning accuracy, the intraday market is the most important tool for correcting plan deviations and reducing imbalance fees.
Core Decision Logic for Intraday Market Use
Decision Framework: Should You Trade in the Intraday Market?
When shortage imbalance is forecast:
If forecast imbalance fee > intraday market buy price → Buy in the intraday market to cover the shortfall
If forecast imbalance fee < intraday market buy price → Accepting the imbalance penalty is more economical
When surplus imbalance is forecast:
If intraday market sell price > forecast surplus imbalance fee → Sell in the intraday market
If intraday market sell price < forecast surplus imbalance fee → Accepting the surplus imbalance is more favorable
Building an Automated Trading System
For participants who frequently adjust supply-demand plans, manual intraday market trading is inefficient and error-prone. Building an automated trading system is a critical investment for improving intraday market utilization. A complete automated system should include the following modules:
- Real-time supply-demand deviation monitoring: Updates plan vs. actual differences every 5 minutes
- Imbalance fee forecasting module: Calculates expected imbalance fees based on wide-area reserve margin forecasts
- Intraday market price monitoring: Real-time tracking of bid/ask prices and volumes
- Optimization decision module: Compares expected costs across strategies and auto-generates trade orders
- Risk management module: Sets position limits, price caps, and other risk parameters
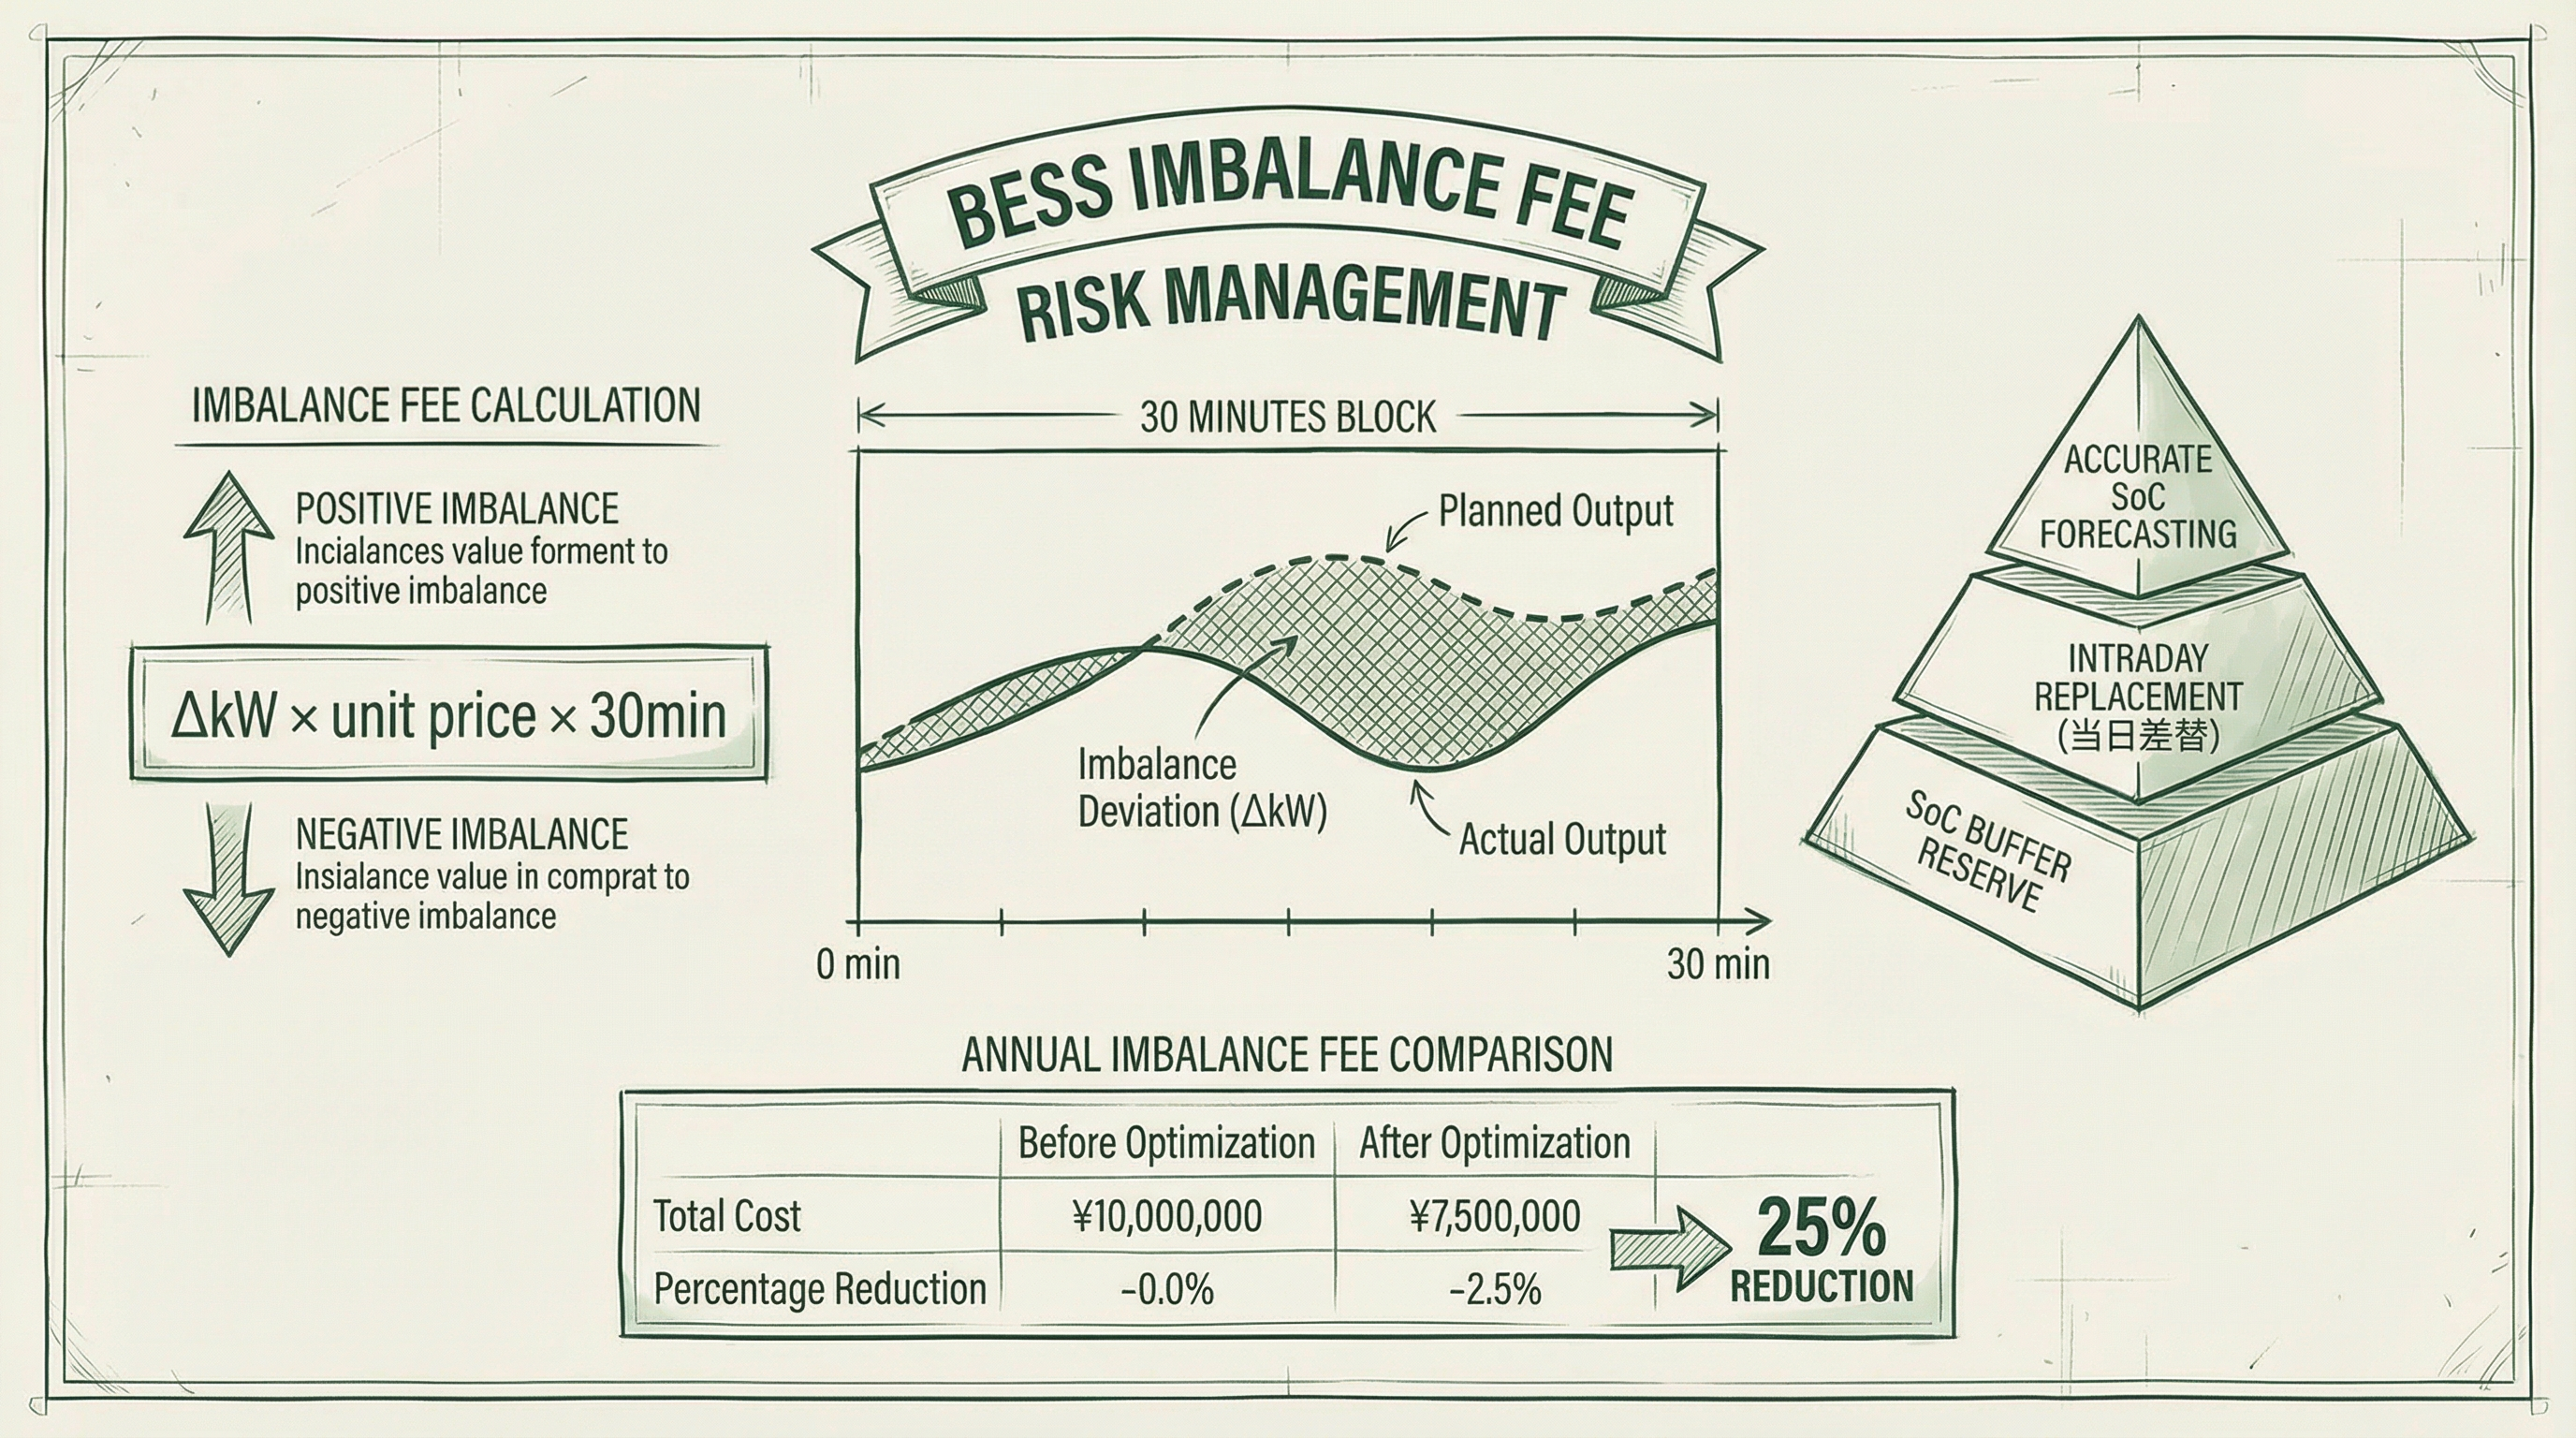
IV. Battery Storage Integration Strategy
Battery Energy Storage Systems (BESS) are the most direct means of addressing renewable energy output uncertainty and reducing imbalance fees. With continued battery cost declines, BESS economics have improved substantially by 2026.
BESS Multi-Revenue Stacking Model
| Revenue Source | Mechanism | Annual Revenue Estimate (1MW/2MWh System) |
|---|
| Imbalance fee reduction | Charge/discharge to correct forecast errors | ¥5–15M/year |
| Spot market arbitrage | Charge at low prices, discharge at high prices | ¥3–8M/year |
| Adjustment capacity market (Tertiary ②) | Provide upward/downward adjustment capacity | ¥2–6M/year |
| Capacity market revenue | Compensation for kW value | ¥1–3M/year |
| Supply-tight DR compensation | Demand suppression and generation support | ¥0.5–2M/year (frequency-dependent) |
V. Building a Systematic Supply-Demand Management Framework
The maximum benefit of the tools described above—AI forecasting, intraday market, BESS, and DR—is only realized when they are integrated into a systematic supply-demand management framework rather than operating independently.
Three-Layer Framework Architecture
Layer 1: Day-Ahead Plan Optimization (D-1)
- AI demand forecasting (72-hour horizon)
- Renewable energy output forecasting
- Spot market bid optimization
- BESS initial schedule setting
- DR advance notification (price-responsive)
Layer 2: Same-Day Real-Time Adjustment (D-0)
- Real-time supply-demand deviation monitoring (5-minute updates)
- Automated intraday market trading
- BESS charge/discharge real-time adjustment
- Emergency DR activation decision
- Wide-area reserve margin monitoring and alerts
Layer 3: Post-Delivery Analysis and Improvement (D+1 onwards)
- Imbalance fee actual performance analysis
- Forecast error root cause analysis
- AI model retraining
- Strategy parameter optimization
- KPI tracking (MAPE, imbalance fee/kWh)
KPI Framework and Performance Management
| KPI | Calculation | Target (Reference) | Monitoring Frequency |
|---|
| Demand Forecast MAPE | Mean of |forecast − actual| / actual | < 3% (day-ahead), < 2% (1-hour-ahead) | Daily |
| Imbalance Fee/kWh | Monthly total imbalance fees ÷ monthly supply volume | < ¥0.5/kWh | Monthly |
| Intraday Market Utilization Rate | Intraday correction volume ÷ total imbalance volume | > 60% | Weekly |
| BESS Utilization Rate | Actual charge/discharge hours ÷ available hours | > 80% | Daily |
| DR Activation Success Rate | Successful DR events ÷ DR activation requests | > 90% | Monthly |
Conclusion
The April 2026 C-value increase marks Japan's electricity market entering a "high penalty cost era." For retail electricity providers, practical imbalance fee management is no longer optional—it is a core competitive capability. AI demand forecasting, intraday market utilization, BESS integration, and DR management must operate in coordination within a systematic framework to deliver maximum impact. In this process, building data infrastructure, developing talent, and enhancing organizational capabilities are more fundamental sources of competitive advantage than any single technology.