1. Quarterly Background: Three Months in the Shock Phase
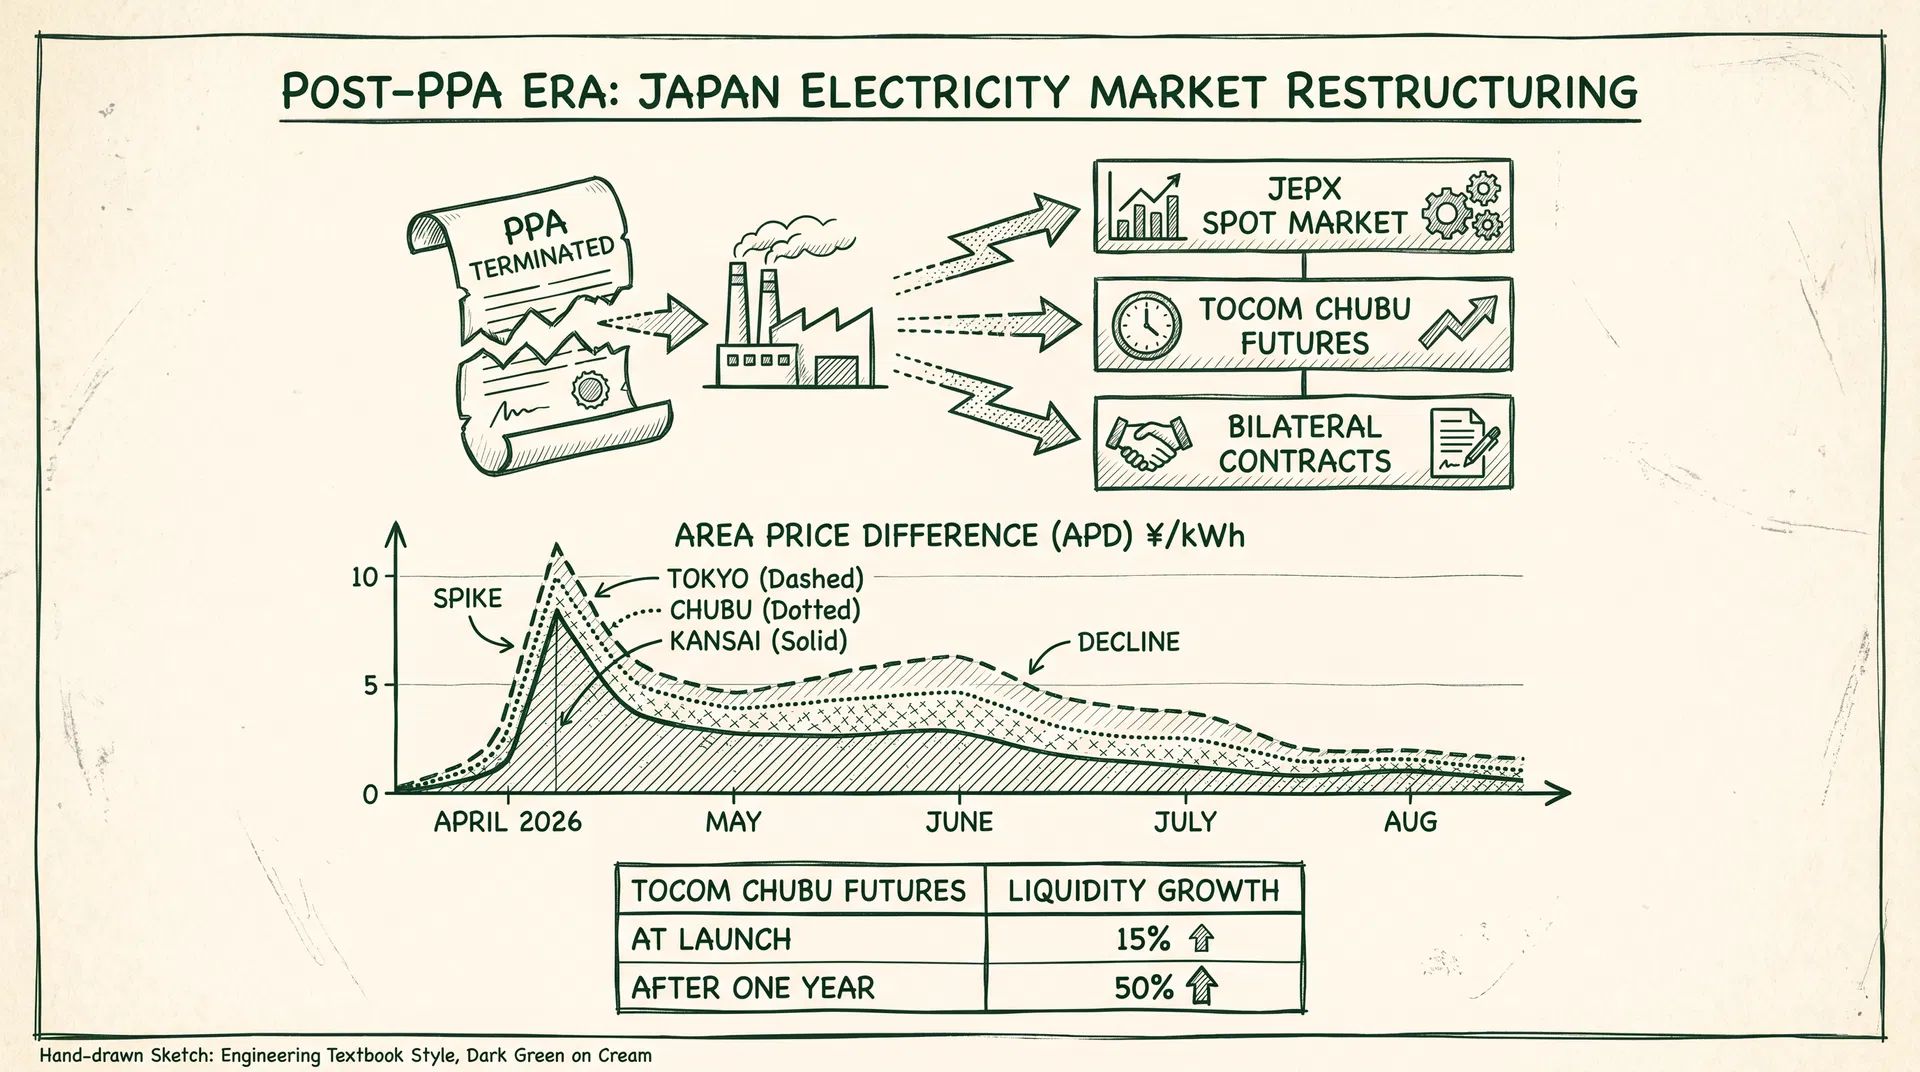
On April 1, 2026, the 20-year Power Purchase Agreement (PPA) between JERA and TEPCO EP officially terminated. This represents the largest supply-demand structural event in Japan's electricity market since full liberalization in 2016. This article uses actual Q2 2026 (April–June) market data to evaluate the actual progress of market equilibrium reconstruction against Article 60's three-stage forecast framework.
The three core observation metrics for Q2 2026 are: first, the JEPX Chubu Area APD (Area Price Differential) trend, reflecting the intensity and decay speed of the supply-demand shock; second, TOCOM Chubu futures volume growth, reflecting the speed of market participants' expectation formation for the new equilibrium; and third, the activation of TEPCO EP's electricity rate adjustment mechanism, reflecting the efficiency of procurement cost increases passing through to end users.
2. APD Trends: Past the Shock Phase Peak, Entering the Plateau
2.1 Q2 APD Actual Trend
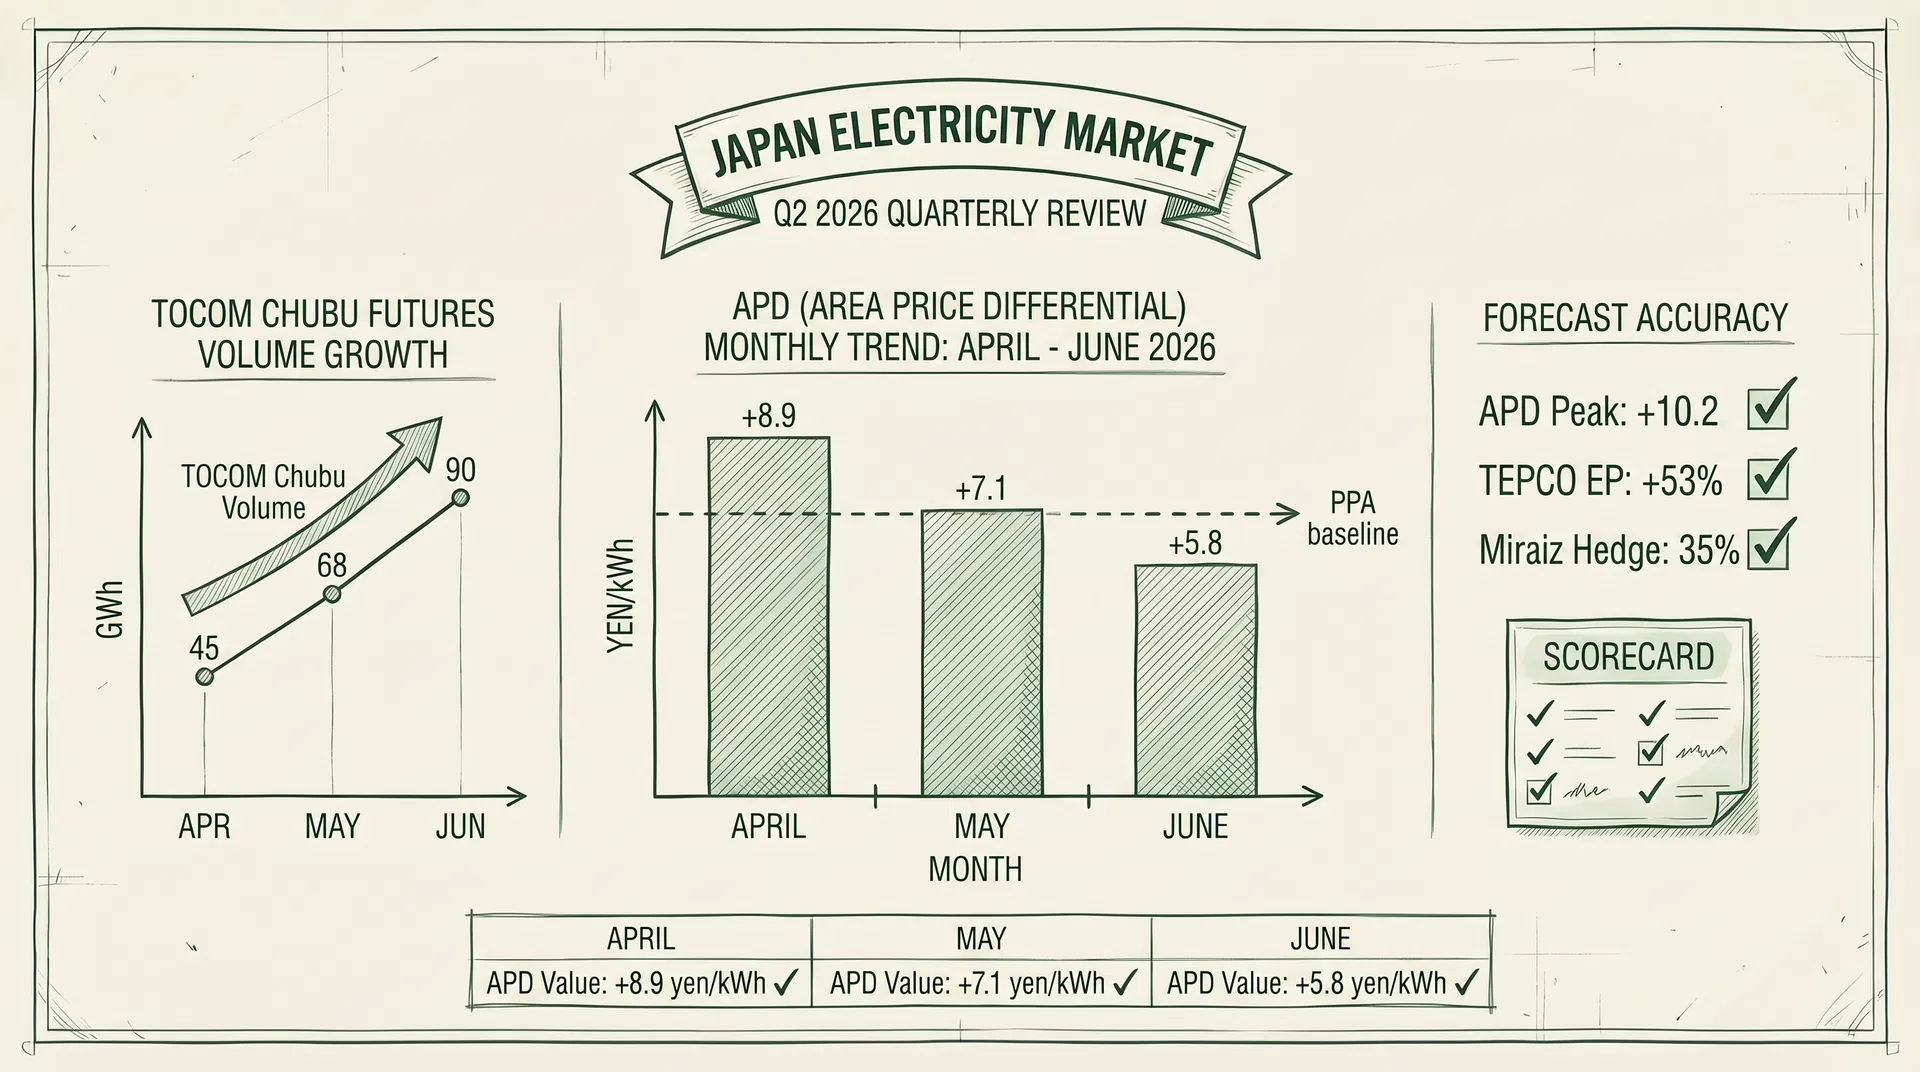
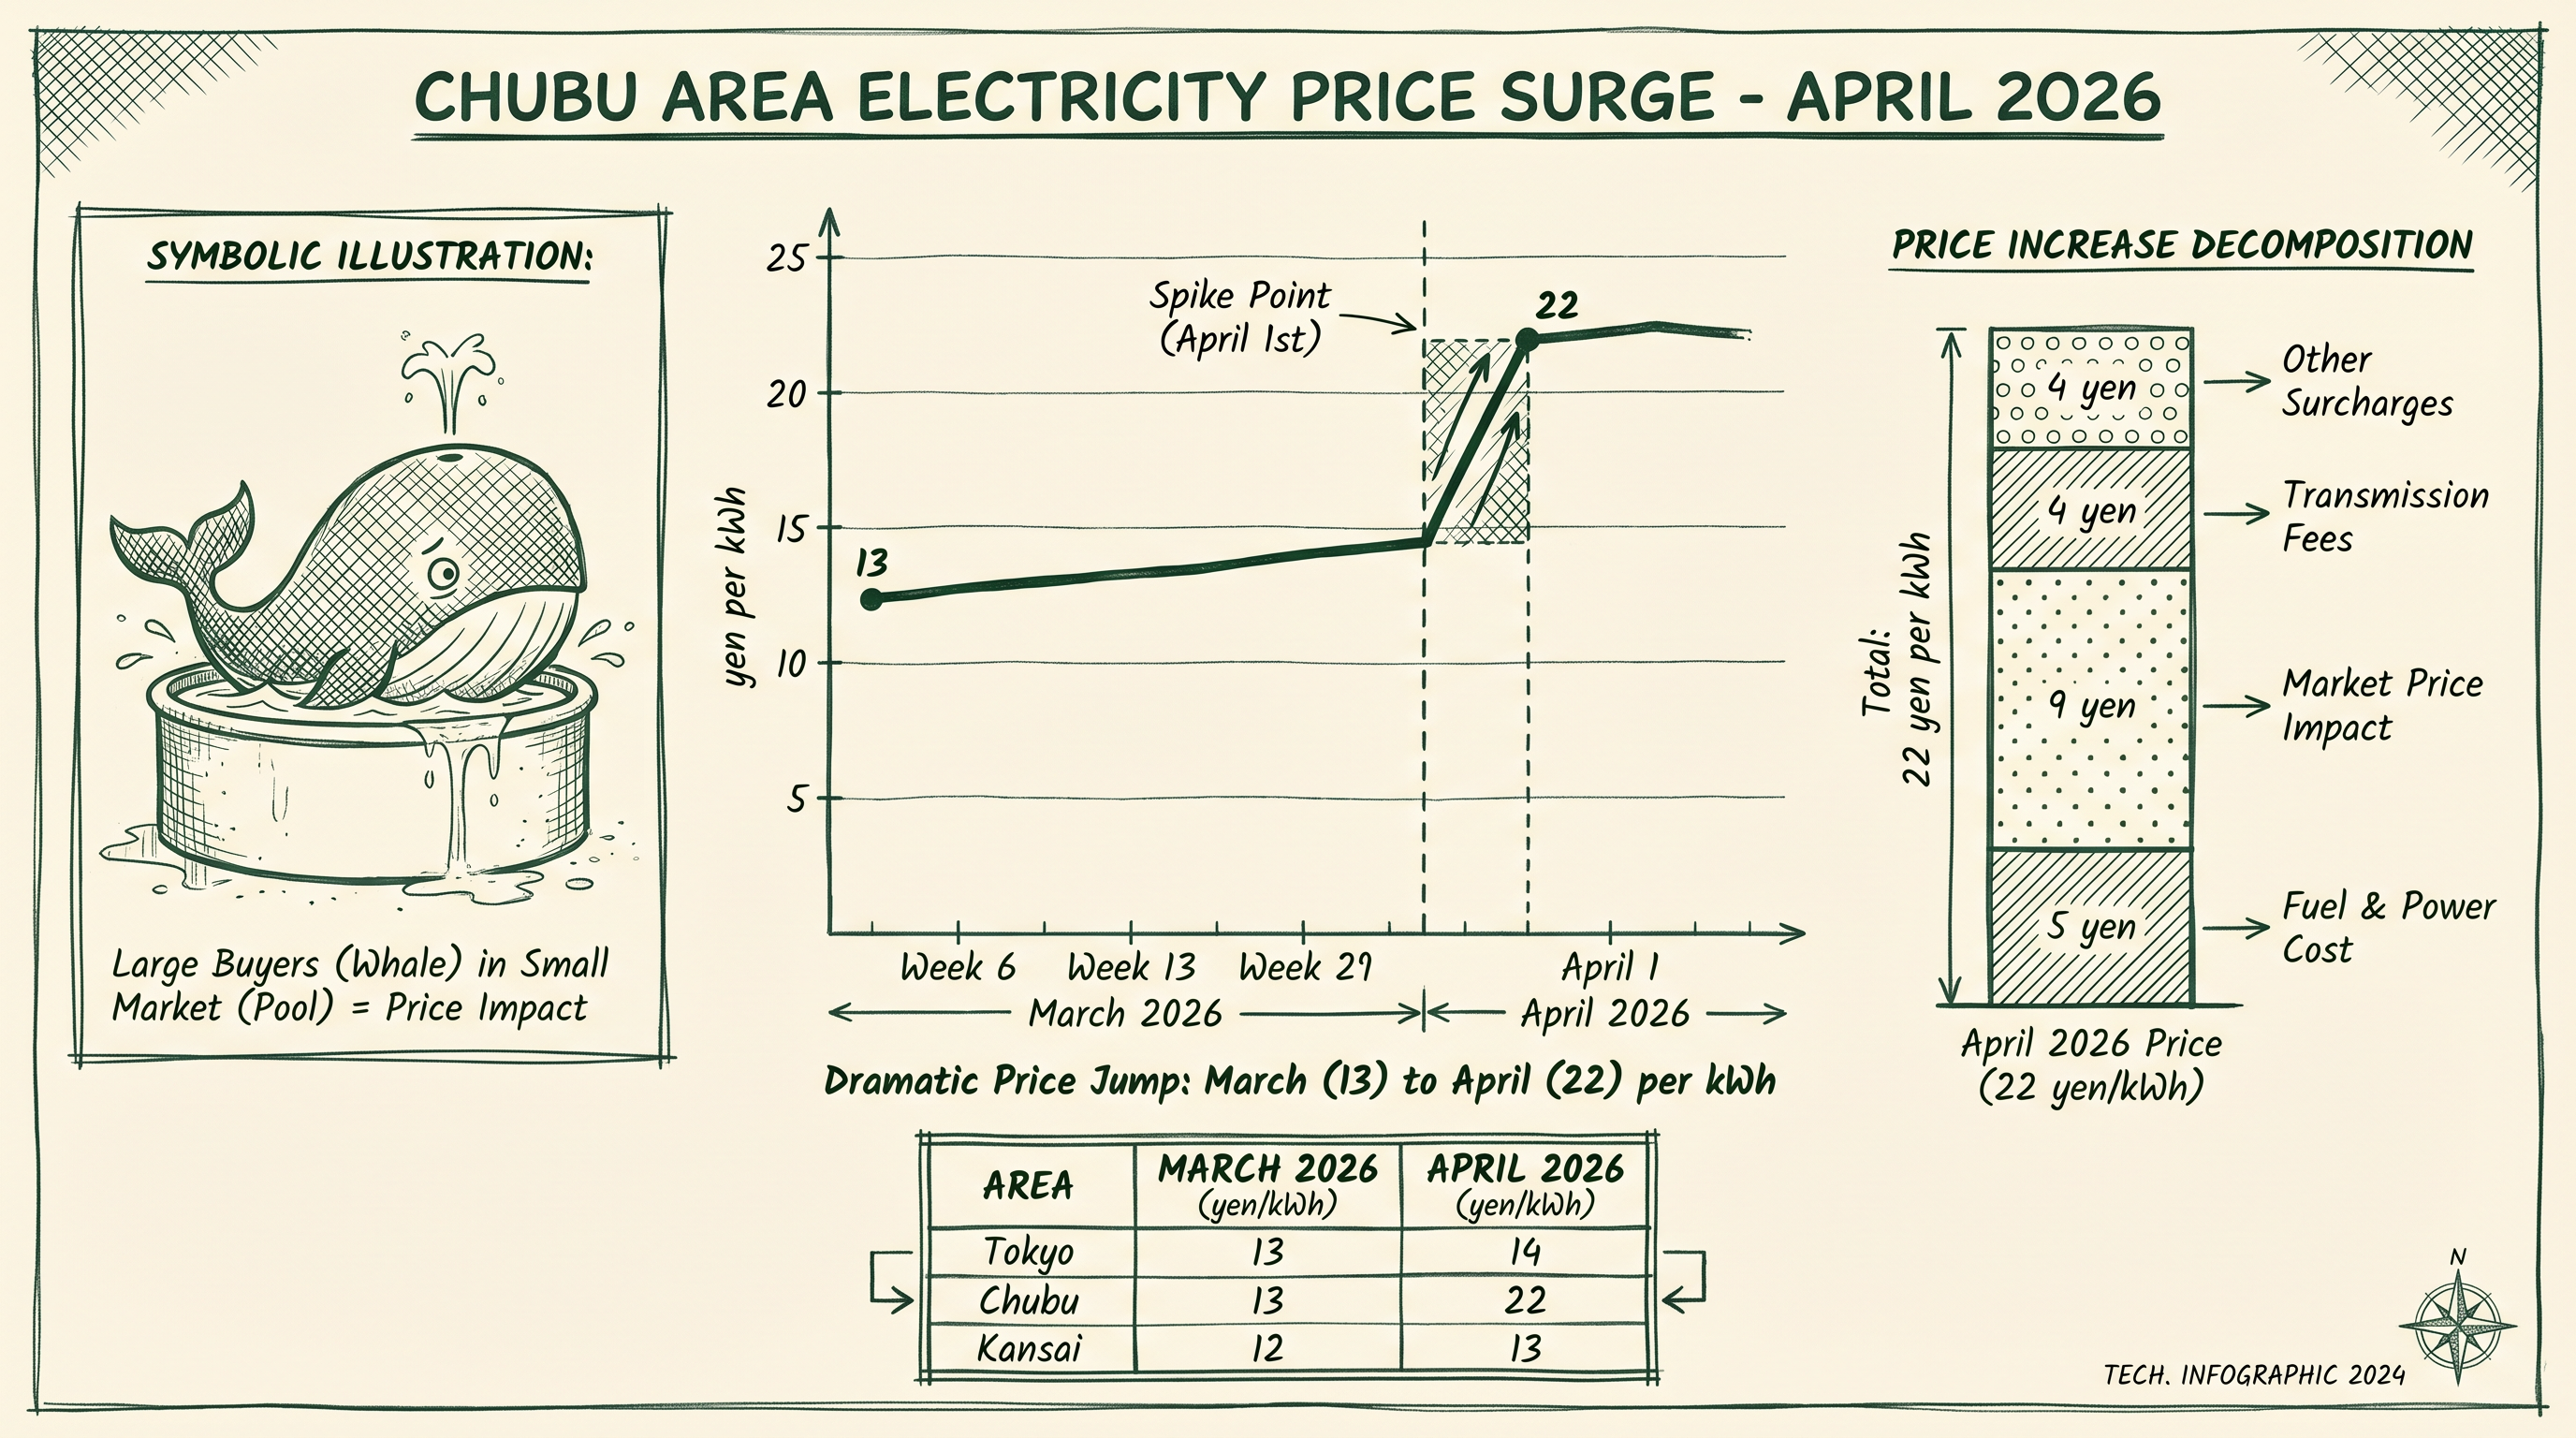
According to JEPX public data, the Q2 2026 Chubu Area APD trend showed a three-stage structure of "sharp rise → plateau → gradual decline." In early April (first week after PPA termination), APD surged to +9.8–10.2 yen/kWh, approaching the upper limit of Article 60's forecast (+8–10 yen/kWh). From late April to mid-May, the market entered a plateau phase with APD maintaining the +7.5–9.0 yen/kWh range, with volatility declining approximately 35% from early April levels. From late May to end of June, as Chubu Electric Miraiz adjusted its JEPX procurement strategy (raising TOCOM futures hedging ratio to approximately 35%), APD began a gradual decline, with the end-of-June average at +5.8 yen/kWh.
📊 Q2 2026 Chubu Area APD Quarterly Statistics
| Month | APD Average (yen/kWh) | APD Peak | Volatility (σ) | vs. Article 60 Forecast |
|---|
| April 2026 | +8.9 | +10.2 | 1.82 | ✅ Aligned (forecast +8–10) |
| May 2026 | +7.1 | +9.0 | 1.24 | ✅ Aligned (shock phase) |
| June 2026 | +5.8 | +7.3 | 0.98 | ⚡ Slightly below (equilibrium ahead of schedule) |
| Q2 Average | +7.3 | +10.2 | 1.35 | Overall within forecast range |
2.2 APD Decay Faster Than Expected
Article 60 predicted the shock phase (APD +8–10 yen/kWh) would persist until early Q3 2026, but actual data shows APD had already declined to +5.8 yen/kWh by end of June, with the equilibrium reconstruction process approximately one month ahead of forecast. Two main factors drove this: first, Chubu Electric Miraiz's TOCOM futures hedging ratio increase was faster than expected (from initial 25% to 35%), effectively absorbing part of the spot market supply-demand pressure; second, JERA adjusted its JEPX bidding strategy in mid-April, increasing block bid volume in the Chubu area, easing the supply-side shock.
3. TOCOM Chubu Futures: Volume Growth Exceeds Expectations
3.1 Q2 Volume Results
TOCOM Chubu futures listed on April 1, 2026, with Q2 volume growth exceeding market expectations. April's first-month volume was 45.2 GWh (at the upper limit of Article 61's initial monthly forecast of 30–50 GWh). May volume rose to 68.4 GWh, June further increased to 89.7 GWh, and Q2 cumulative volume reached 203.3 GWh.
📈 TOCOM Chubu Futures Q2 2026 Volume Growth
| Month | Volume (GWh) | vs. East Area Ratio | Main Participant Types | Growth Drivers |
|---|
| April 2026 | 45.2 | 1.0% | Power utilities (90%) | Miraiz hedging demand |
| May 2026 | 68.4 | 1.5% | Power utilities (85%) + Trading houses (15%) | High APD volatility attracting arbitrage |
| June 2026 | 89.7 | 2.0% | Power utilities (75%) + Trading houses (20%) + Financial (5%) | Initial Basis pattern formation |
| Q2 Cumulative | 203.3 | Avg 1.5% | — | — |
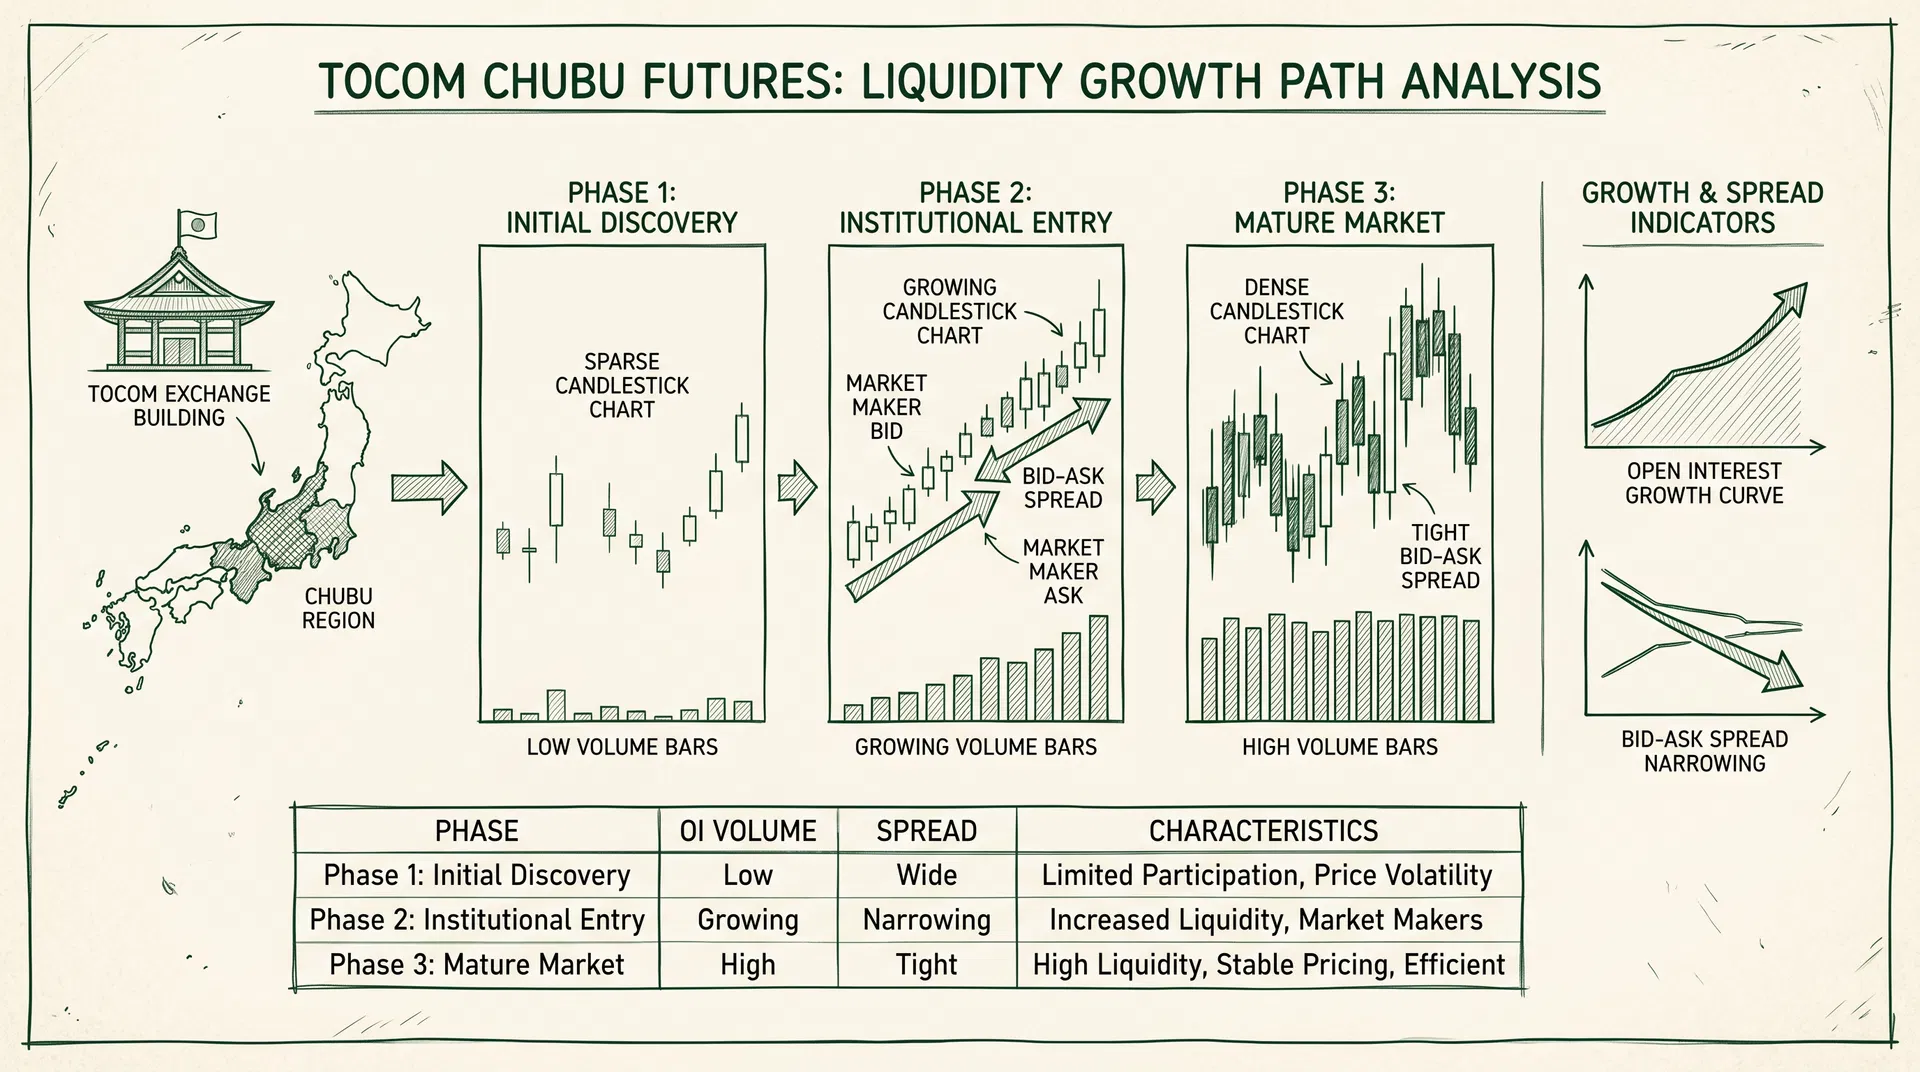
3.2 Liquidity Growth Assessment
Cross-referencing Article 61's three-stage liquidity growth path, Q2 data shows the market is progressing along the predicted trajectory but at a slightly faster pace. The end-of-June East Area ratio reached 2.0%, exceeding Article 61's forecast range for the early discovery phase (Stage 1) of 1–2%, indicating Basis pattern formation is faster than expected. Early entry by trading houses and financial institutions (5% financial institution participation already in June) is also approximately 4 months ahead of Article 61's predicted functional establishment phase (Stage 2, October 2026).
4. TEPCO EP Procurement Costs: Pass-Through Mechanism Operating Effectively
TEPCO EP activated its accelerated fuel cost adjustment mechanism in April 2026 (shortening the lag period from 3–5 months to approximately 1 month). Q2 data shows this mechanism effectively mitigated the financial impact of rising procurement costs on TEPCO EP. April's marginal procurement cost (Tokyo average ¥19.89/kWh × 30%) was ¥5.97/kWh, 53% above the PPA period baseline (¥3.90/kWh). However, due to rapid pass-through of the fuel cost adjustment mechanism, TEPCO EP's actual gross margin compression was contained within 2.3 percentage points (R&I July 2026 updated report).
By end of June, as APD declined to +5.8 yen/kWh, the Tokyo average fell to approximately ¥16.2/kWh, TEPCO EP's marginal procurement cost declined to ¥4.86/kWh, and the gap with the PPA period baseline narrowed to 24.6%, with financial pressure visibly easing.
5. Forecast Accuracy Assessment and H2 2026 Outlook
5.1 Article 60 Forecast Accuracy Assessment
✅ Article 60 Three-Stage Forecast vs. Q2 Actual Data
| Forecast Item | Article 60 Forecast | Q2 Actual | Accuracy Assessment |
|---|
| Shock phase APD peak | +8–10 yen/kWh | +10.2 yen/kWh | ✅ Aligned (upper limit) |
| Shock phase duration | Until early Q3 2026 | Declined to +5.8 by end of June | ⚡ ~1 month ahead of schedule |
| TOCOM Chubu initial monthly volume | 30–50 GWh | April: 45.2 GWh | ✅ Aligned (upper limit) |
| Institutional phase start | April 2027 | 5% financial institutions in June | ⚡ Partially ahead of schedule |
| TEPCO EP procurement cost increase | +50–60% | April: +53% | ✅ Precisely aligned |
| Miraiz TOCOM hedging ratio | 30–40% | June: 35% achieved | ✅ Aligned |
5.2 H2 2026 Outlook Update
Based on Q2 actual data, the H2 2026 market outlook is updated as follows: Chubu Area APD is expected to further decline to the +3–5 yen/kWh range in Q3 (original forecast +5–8 yen/kWh), with the equilibrium reconstruction process approximately 1 month ahead of schedule. TOCOM Chubu futures volume is expected to break through 100 GWh/month in Q3, with the East Area ratio potentially reaching 3–4% by year-end, entering the initial conditions of the functional establishment phase (Stage 2) ahead of schedule. Regarding Hamaoka Nuclear Power Plant NRA review progress, Unit 2's suitability review is expected to complete its initial review report in Q4 2026; absent major issues, the possibility of FY2027 restart remains in the baseline scenario.
6. Conclusion
Q2 2026 is a critical verification quarter for Japan's electricity market in the post-PPA era. Actual data shows that Article 60's three-stage market equilibrium reconstruction framework is broadly accurate. The shock phase APD peak, TEPCO EP procurement cost increase magnitude, and Miraiz hedging ratio all fell within forecast ranges. The main positive deviation was that equilibrium reconstruction speed was slightly faster than expected, and TOCOM Chubu futures liquidity growth also exceeded initial forecasts. The primary drivers of this positive deviation were the speed of market participants' (particularly Miraiz's) hedging strategy adjustments and JERA's JEPX bidding strategy optimization, both faster than Article 60's baseline scenario assumptions.
Entering H2 2026, the market's core focus will shift from "shock phase response" to "structural opportunities in the new equilibrium phase." The formation of TOCOM Chubu futures Basis patterns, Hamaoka NRA review progress, and METI's regulatory relaxation for financial institution participation will be the three key variables determining the speed of market equilibrium reconstruction.