Executive Summary
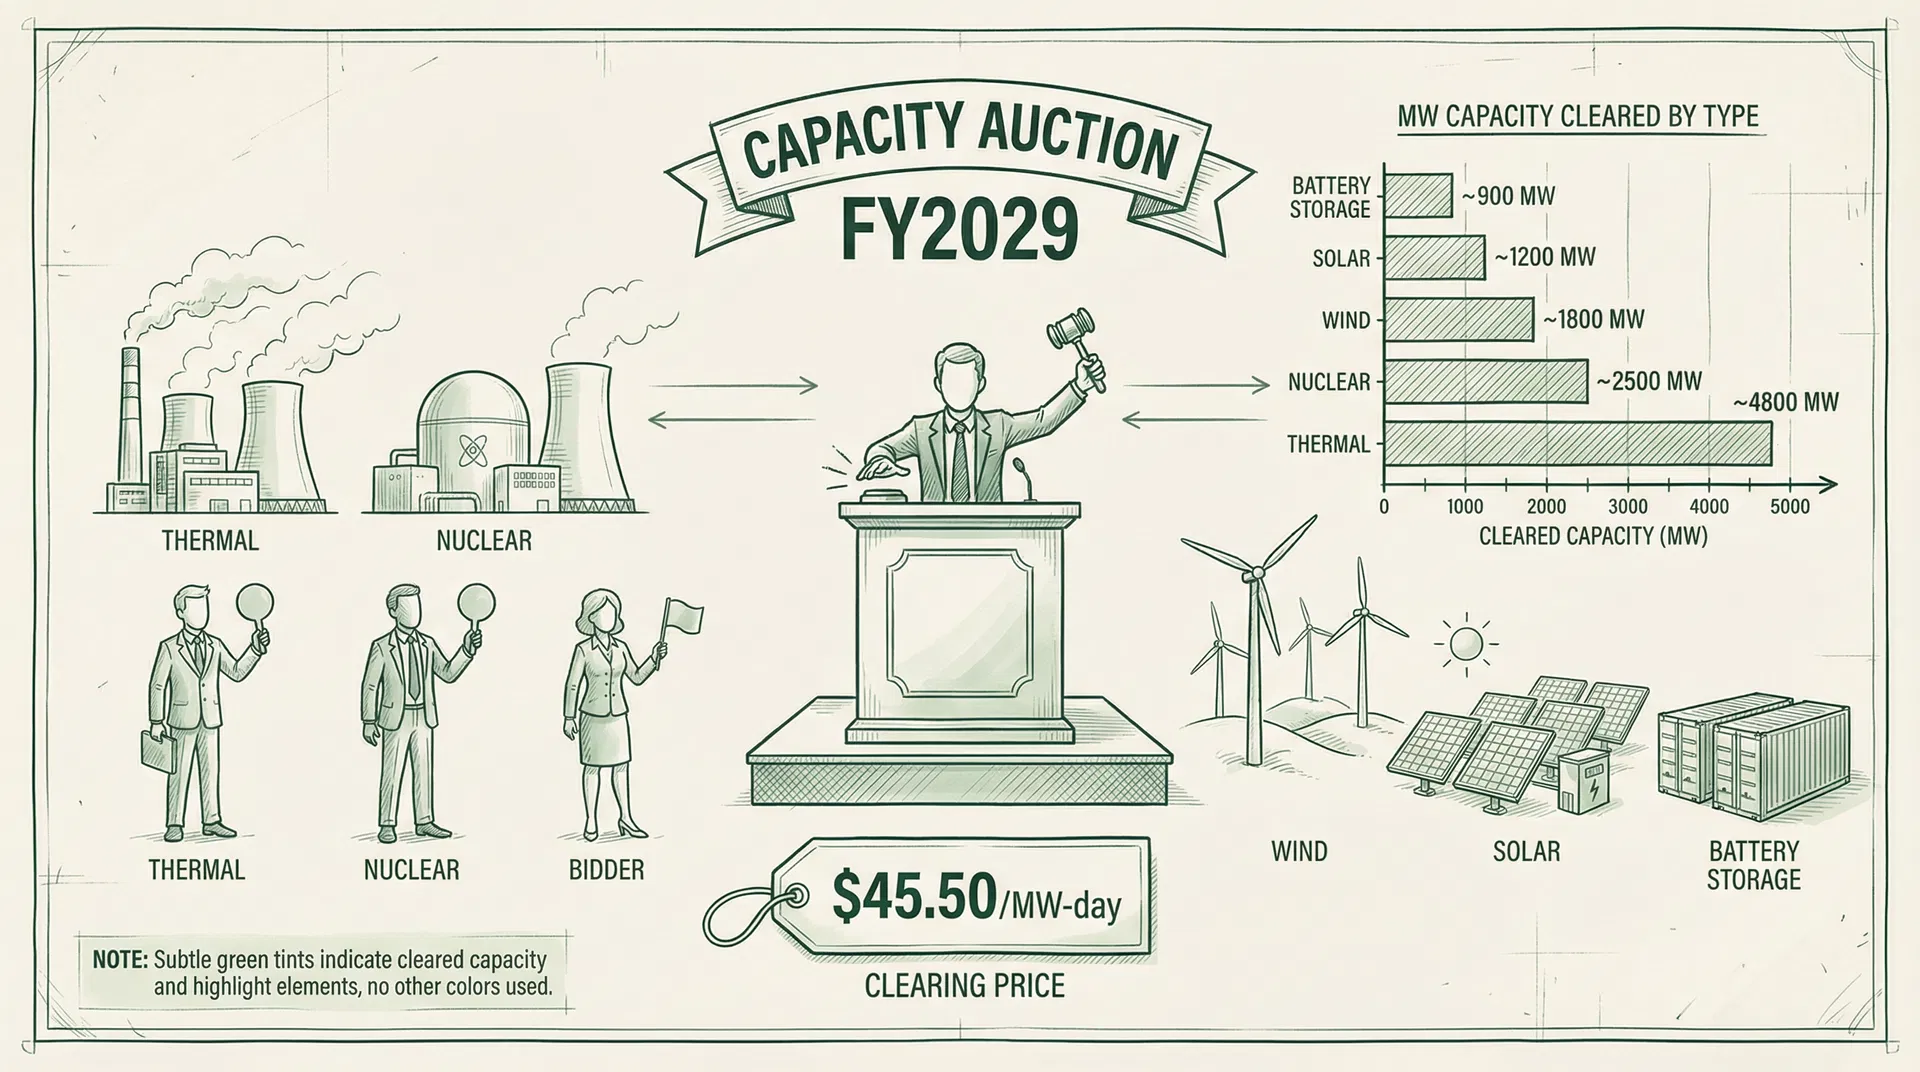
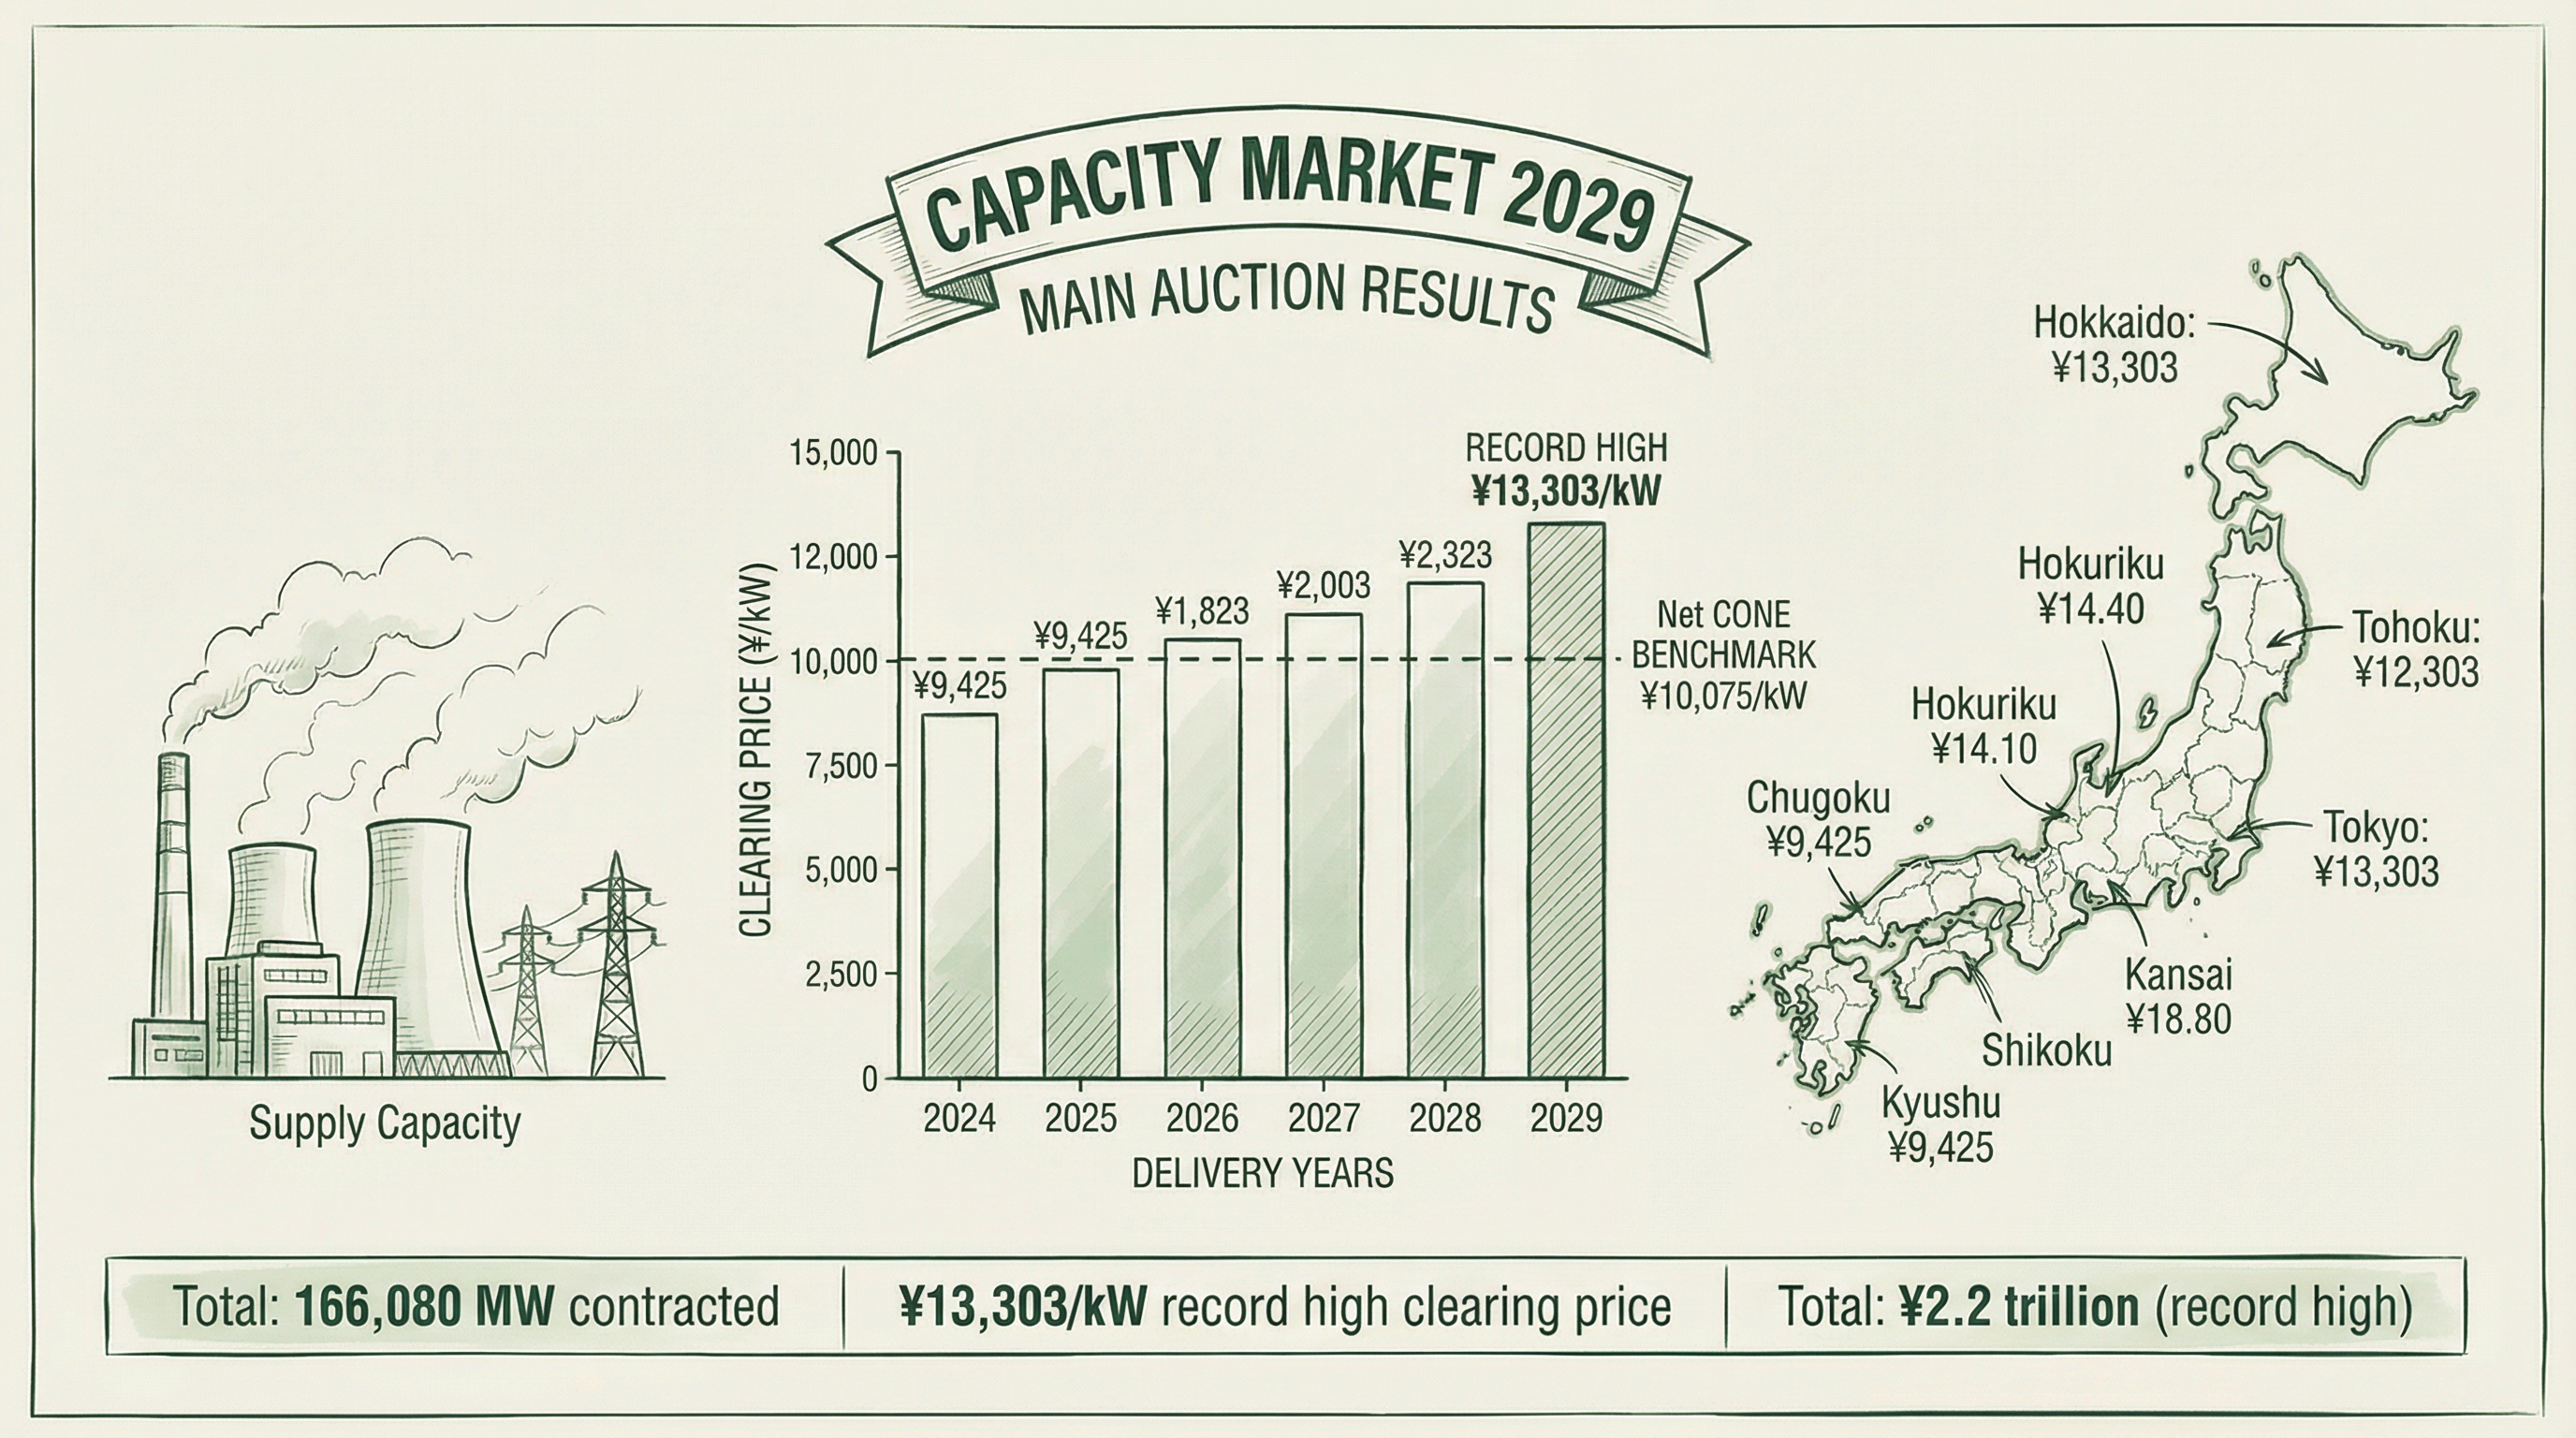
The Organization for Cross-regional Coordination of Transmission Operators, Japan (OCCTO) published on January 20, 2026 the results of the FY2025 capacity market main auction targeting the FY2029 supply year. Total cleared capacity reached 166,079,863 kW (approximately 166.08 GW), with a total contracted value (after transitional measure deductions) of ¥2,209,359,548,463 (approximately ¥2.21 trillion). The Net CONE (reference price) was set at ¥10,075/kW. This analysis examines regional price divergence, market segmentation drivers, capacity charge allocation, and historical trends based on OCCTO official data.
I. Regional Clearing Results and Market Segmentation
1.1 Area-by-Area Clearing Price Summary
This auction produced pronounced market segmentation, with the national market splitting into four distinct pricing blocks. The "sufficient" block comprising Chubu, Hokuriku, Kansai, Chugoku, and Shikoku cleared at ¥12,388/kW, while the "deficient" blocks of Hokkaido, Tohoku/Tokyo, and Kyushu cleared at ¥14,972–¥15,112/kW — a premium of approximately 22% over the sufficient block.
| Area | Area Price (¥/kW) | Cleared Capacity (GW) | Total Value (¥B) | H3 Demand (GW) |
|---|
| Hokkaido | 14,972 | 5.46 | 78.3 | 5.28 |
| Tohoku | 15,111 | 16.81 | 242.6 | 13.68 |
| Tokyo | 15,111 | 52.38 | 759.0 | 57.03 |
| Chubu | 12,388 | 23.90 | 283.1 | 22.98 |
| Hokuriku | 12,388 | 4.39 | 51.8 | 4.90 |
| Kansai | 12,388 | 27.41 | 324.2 | 26.95 |
| Chugoku | 12,388 | 9.85 | 116.4 | 10.50 |
| Shikoku | 12,388 | 7.52 | 88.8 | 4.59 |
| Kyushu | 15,112 | 18.36 | 265.1 | 15.88 |
| National Total | — | 166.08 | 2,209.4 | 161.79 |
1.2 Market Segmentation: Causes and Supplementary Processing
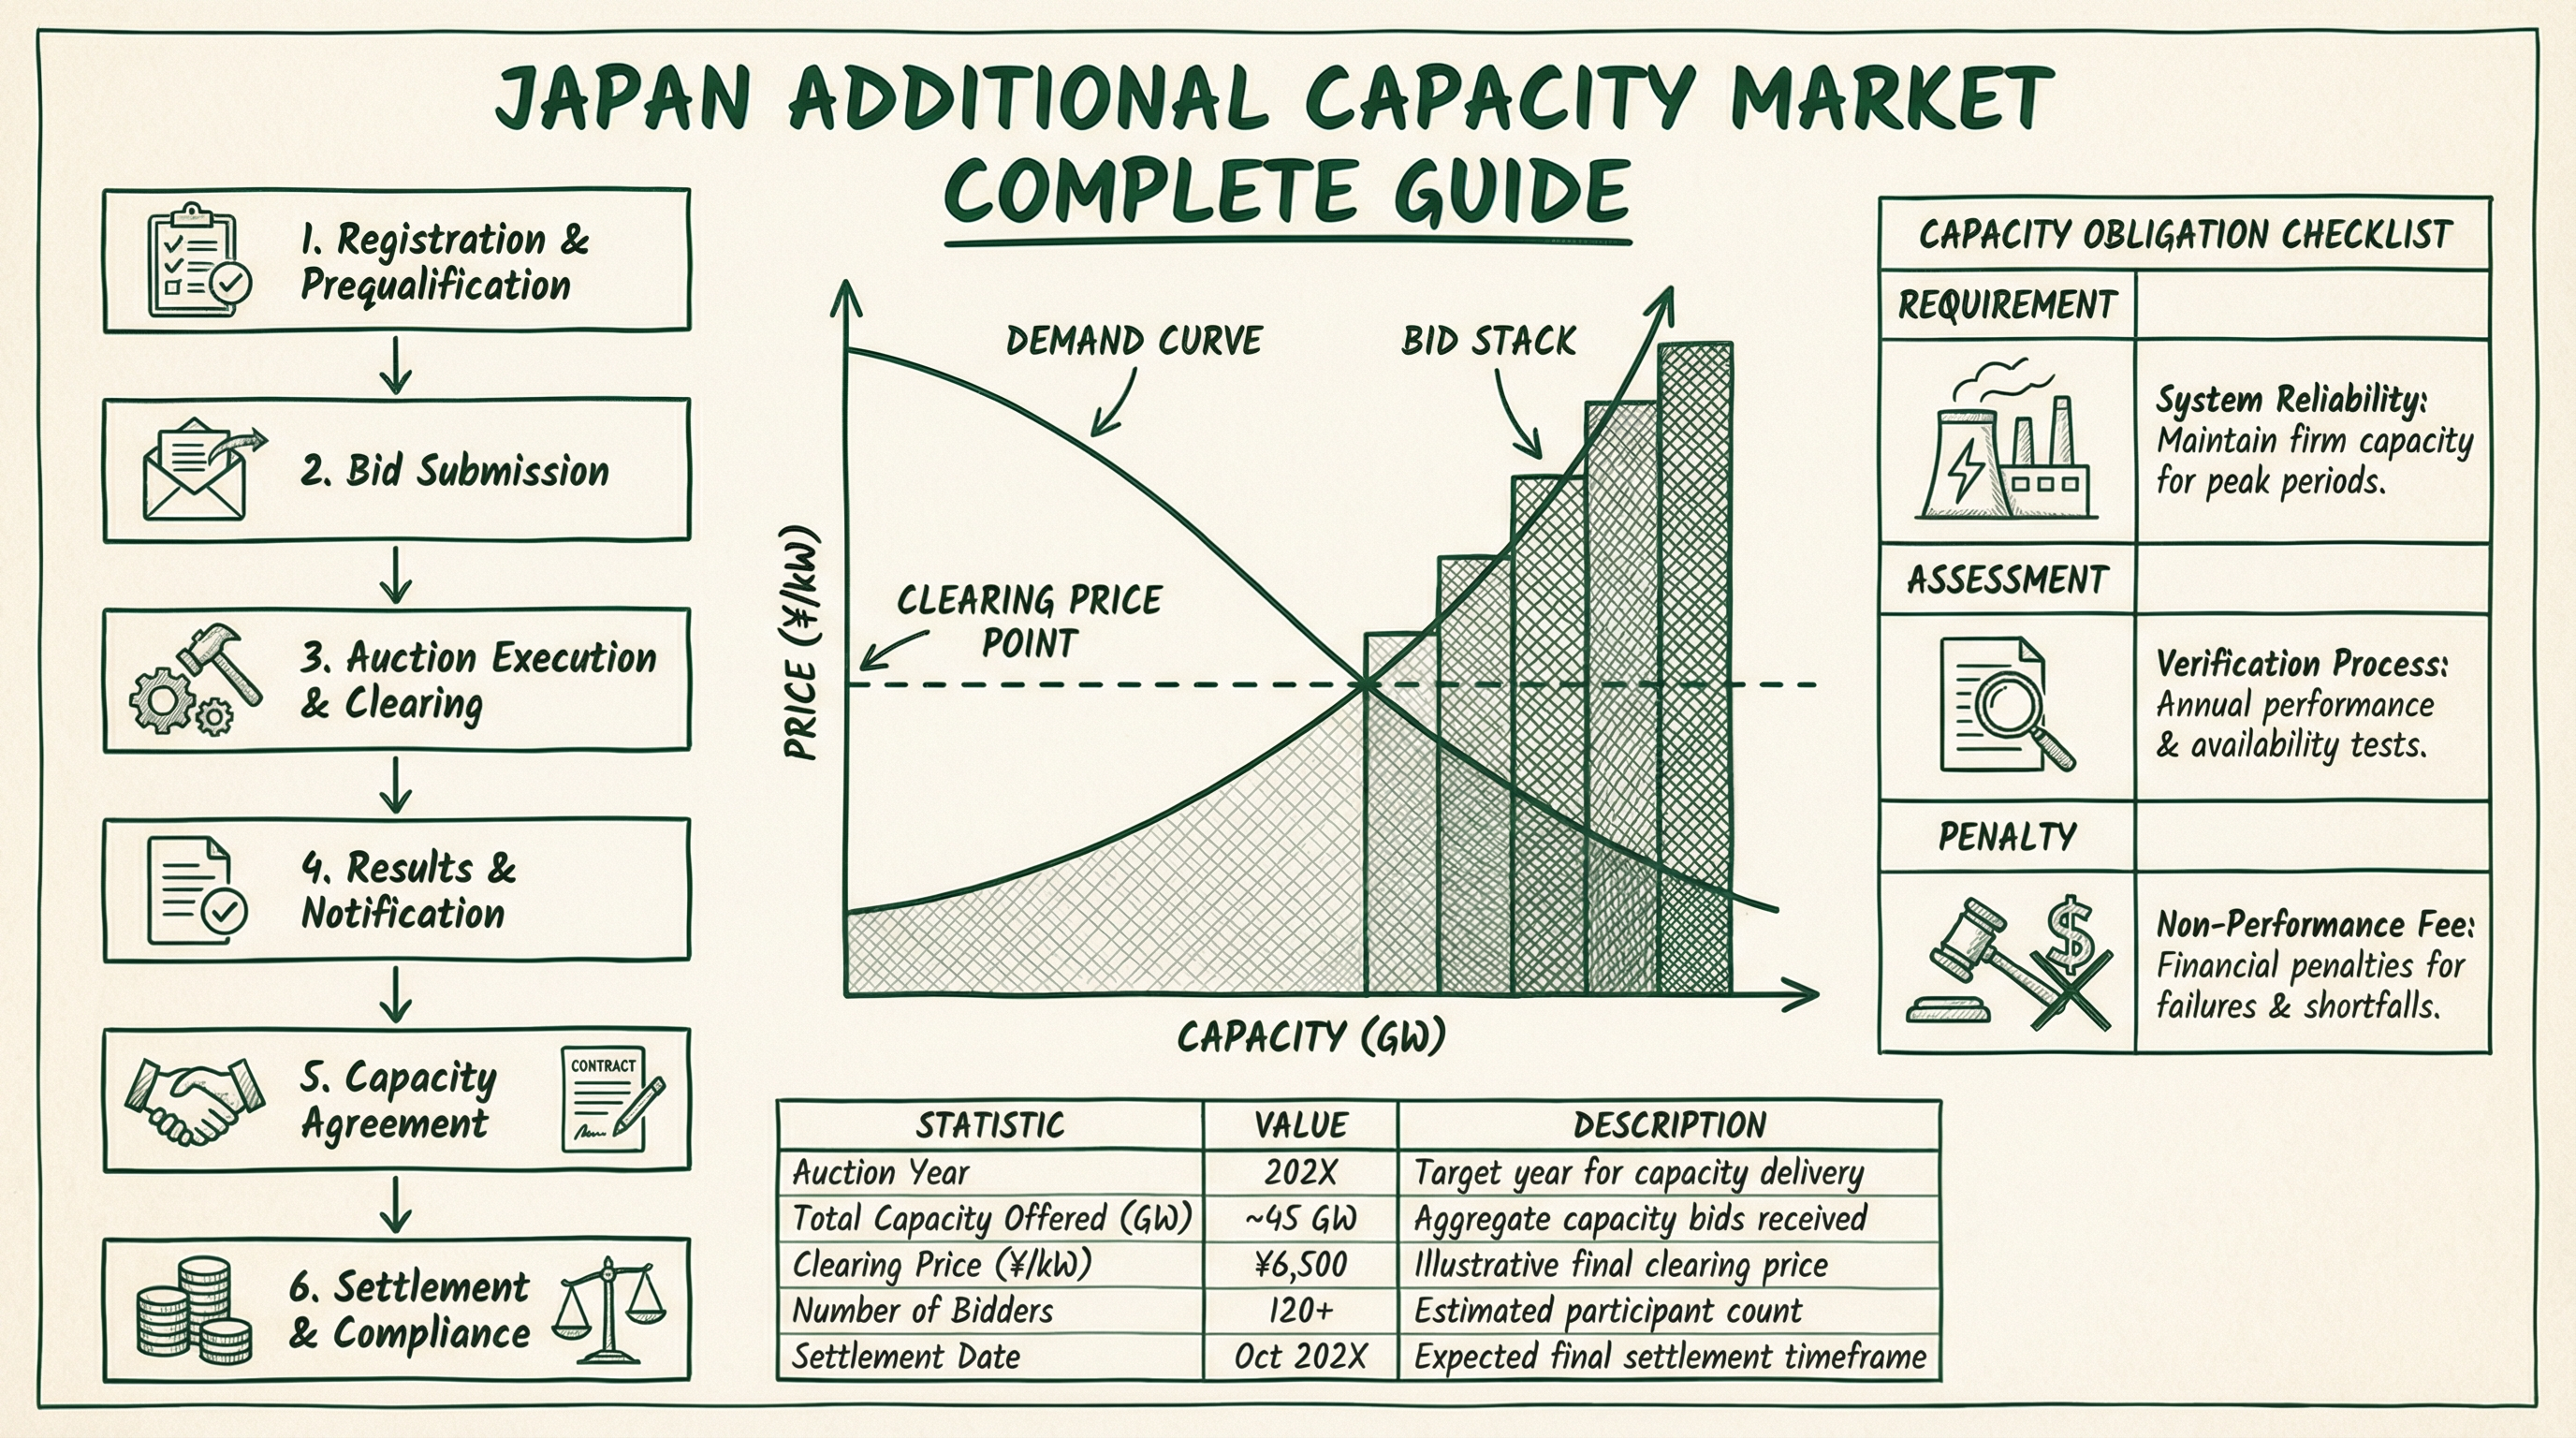
The national supply reliability at the intersection of the demand and supply curves was 0.013 kWh/kW·year, exceeding the target threshold of 0.009 kWh/kW·year. However, at the area level, Chubu, Hokuriku, Kansai, Chugoku, and Shikoku formed a sufficient block while Hokkaido, Tohoku/Tokyo, and Kyushu became deficient blocks, triggering the market segmentation mechanism.
To resolve the deficiency, OCCTO executed supplementary processing totaling 6.88 GW: Hokkaido +0.91 GW, Tokyo +4.32 GW, Kyushu +1.65 GW. The Tohoku/Tokyo block remained partially unresolved after processing (final supply reliability: 0.049 kWh/kW·year), and no reduction processing was performed.
II. Capacity Charge Allocation Structure
2.1 Transmission and Retail Sector Burdens
Under the framework established by the "13th Interim Summary of the System Review Working Group" (August 2023), transmission system operators (TSOs) bear 8% of H3 demand equivalent, while retailers bear the remainder after deducting TSO contributions and transitional measure reductions. The estimated FY2029 capacity charges are as follows.
| Area | TSO (Main, ¥B) | TSO (Long-term, ¥B) | Retail (Main, ¥B) | Retail (Long-term, ¥B) |
|---|
| Hokkaido | 6.33 | 0.15 | 71.41 | 1.83 |
| Tohoku | 16.54 | 0.40 | 184.73 | 4.74 |
| Tokyo | 68.94 | 1.69 | 770.19 | 19.77 |
| Chubu | 22.78 | 0.67 | 256.73 | 7.97 |
| Hokuriku | 4.86 | 0.14 | 54.74 | 1.70 |
| Kansai | 26.71 | 0.79 | 301.06 | 9.35 |
| Chugoku | 10.40 | 0.31 | 117.28 | 3.64 |
| Shikoku | 4.55 | 0.13 | 51.27 | 1.59 |
| Kyushu | 19.19 | 0.46 | 221.66 | 5.52 |
| Total | 180.3 | 4.75 | 2,029.1 | 56.1 |
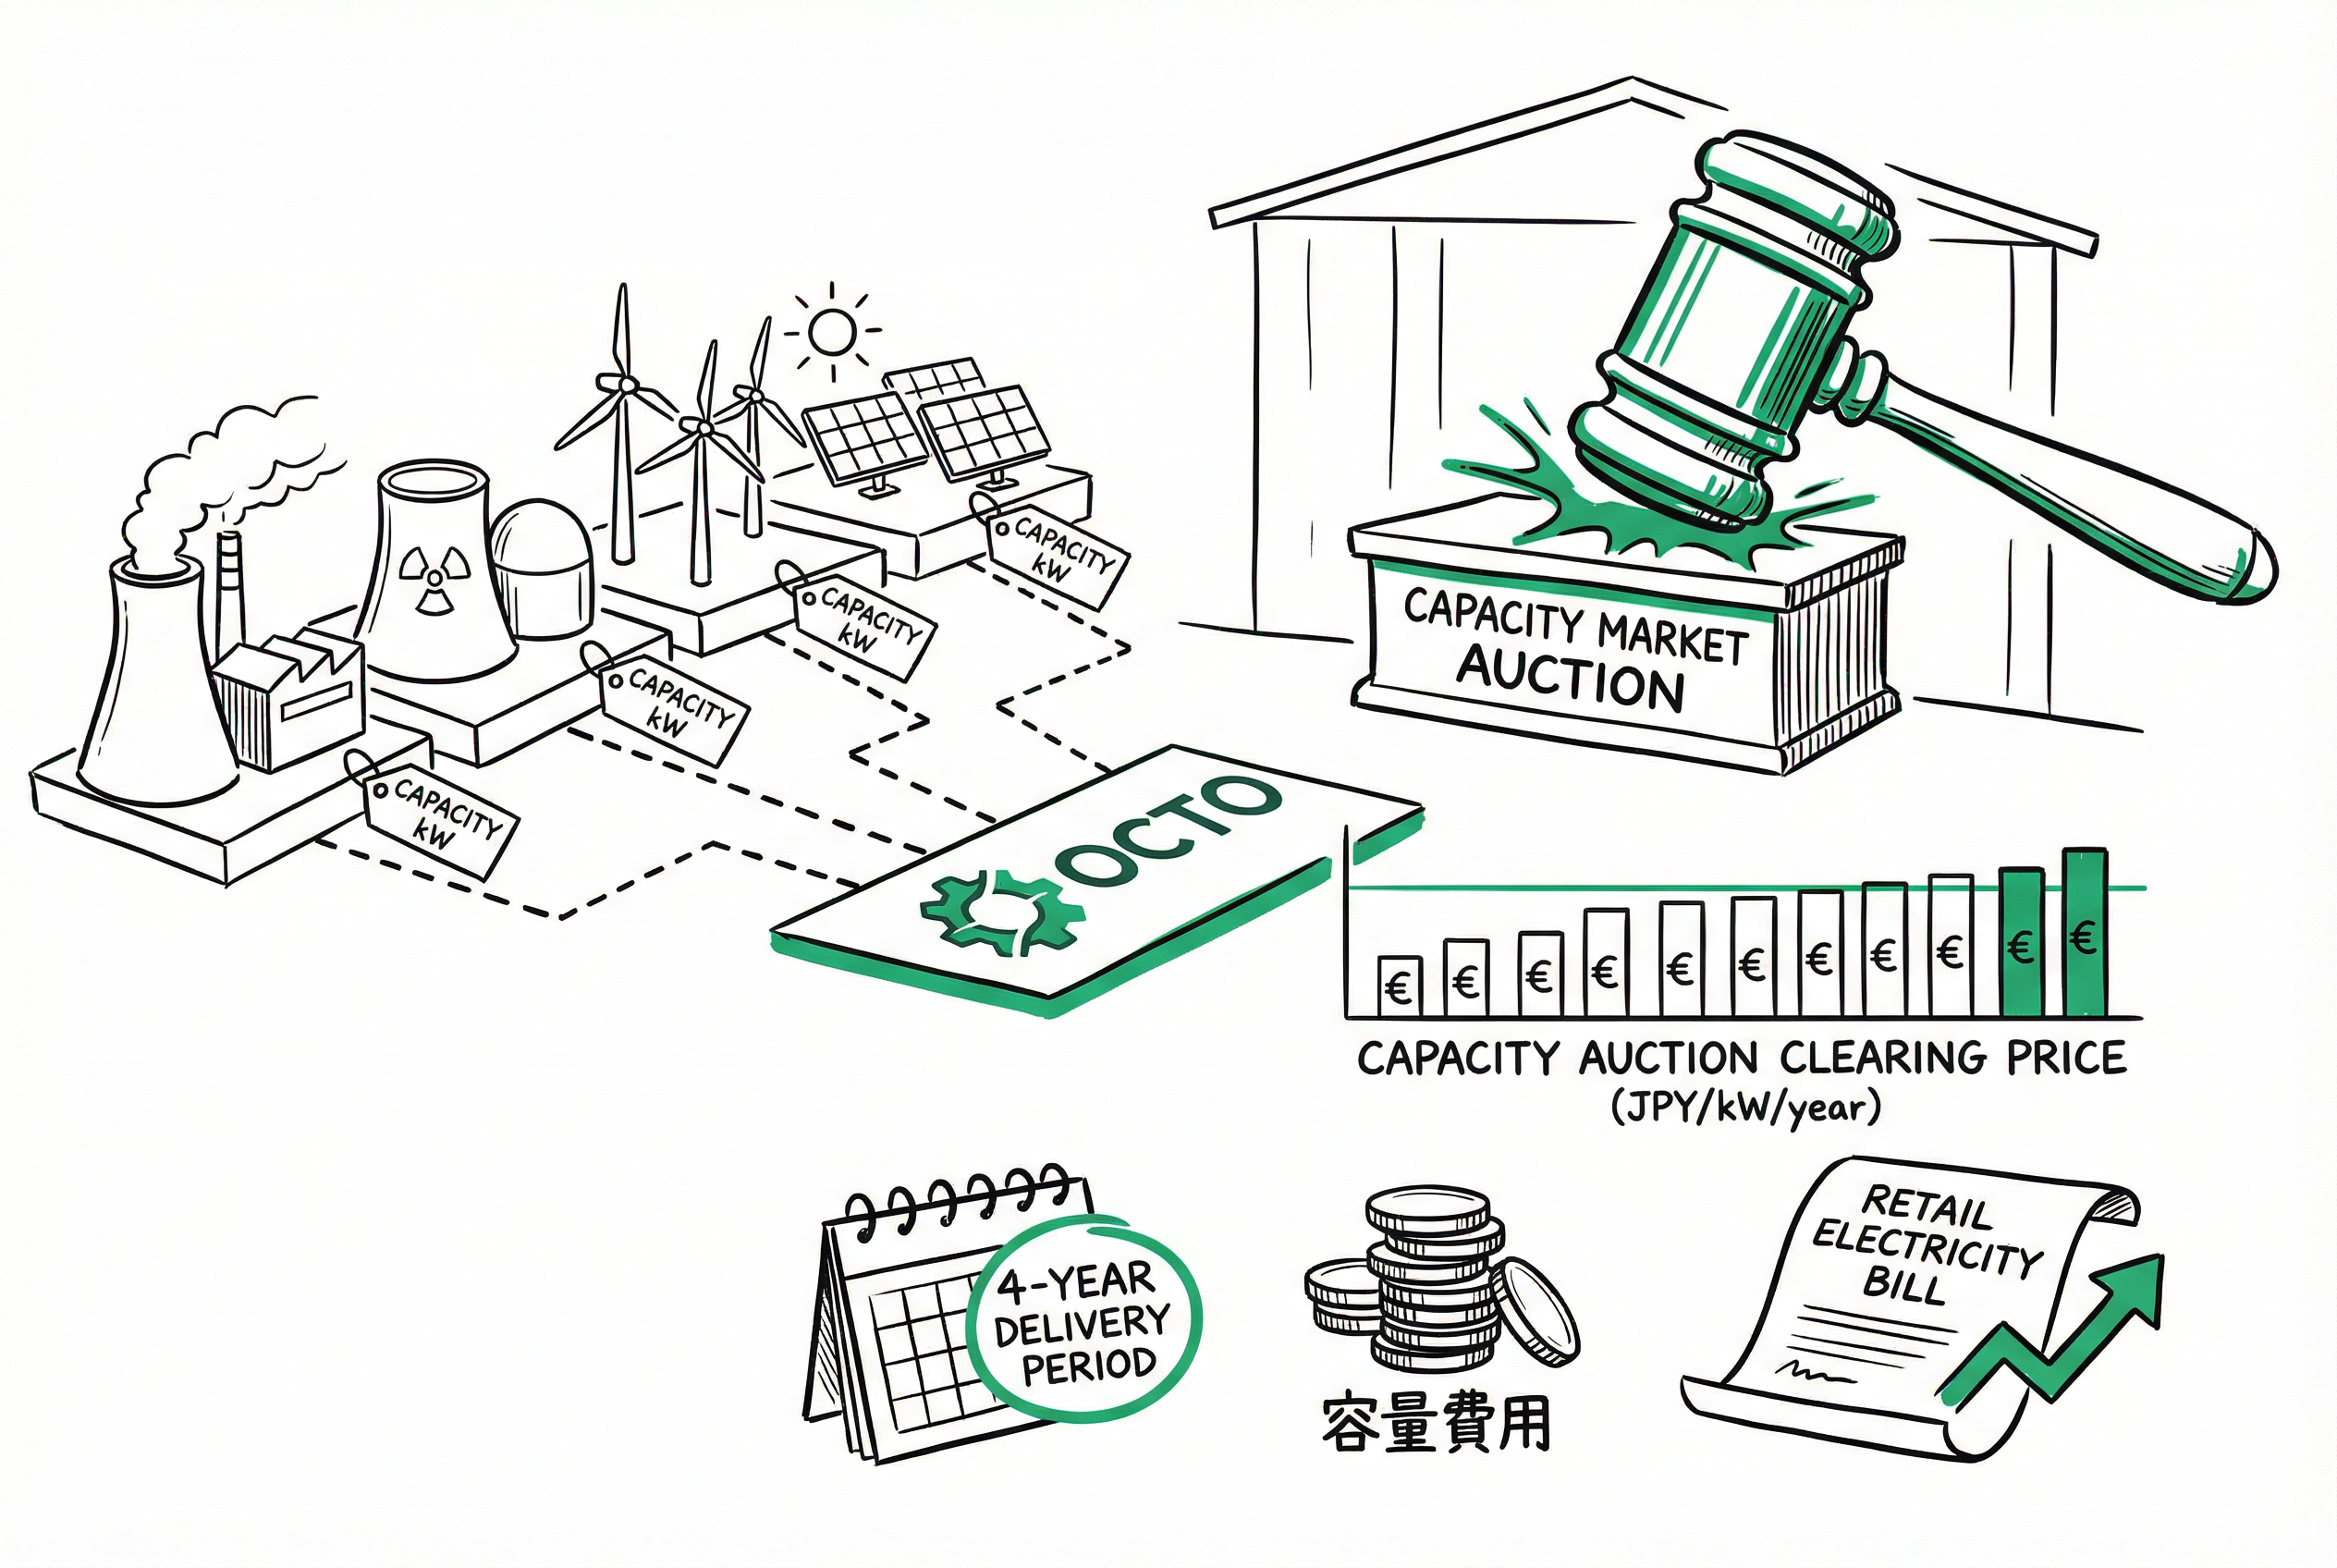
The total retail sector capacity charge burden nationwide amounts to approximately ¥2.085 trillion. This is divided into 12 equal monthly installments and allocated to individual retailers based on their monthly market share during the supply year.
III. Bidding Landscape and Generation Mix Analysis
3.1 Capacity by Generator Category
Total national bid volume reached 172.31 GW, dominated by stable sources at 92.8% (159.97 GW). Variable sources (standalone) accounted for 4.35 GW (2.5%), while demand response (DR) resources contributed 7.15 GW (4.2%). The overall clearing rate was 96.4% (stable: 96.6%, variable: 100%, DR: 89.4%). Of the 6.23 GW that failed to clear, oil/LNG units accounted for 87.8% and units aged 40+ years represented 60.1%, confirming the ongoing retirement of aging thermal capacity.
3.2 Generation Mix
By generation type, LNG thermal led at 67.02 GW (38.9%), followed by coal/co-firing at 38.15 GW (22.1%, including 5.27 GW of inefficient coal at 3.1%), pumped hydro at 22.85 GW (13.3%), nuclear at 12.84 GW (7.5%), and conventional hydro at 12.79 GW (7.4%). Battery storage, while modest at 1.69 GW (1.0%), shows a growing trend reflecting rapid advances in energy storage technology.
3.3 Bid Price Distribution
With a Net CONE of ¥10,075/kW, bid prices exhibited a strongly bimodal distribution: 74.7% of bid volume was offered at ¥0/kW (primarily renewables and DR resources), while 11.2% exceeded the Net CONE. The national weighted average bid price was ¥2,621/kW, with significant regional variation: Hokkaido ¥5,947/kW, Kyushu ¥5,560/kW, versus only ¥1,691/kW for the Chubu/Hokuriku/Kansai/Chugoku/Shikoku block.
IV. Historical Trends: Net CONE and Procurement Volume
Comparing across auction years, Net CONE has risen steadily from ¥9,425/kW in FY2024 to ¥10,075/kW in FY2029, reflecting persistent increases in new-build construction costs. Target procurement volumes have also grown from 177.47 GW to 189.97 GW over the same period, tracking stable growth in Japan's overall electricity demand.
| Supply Year | Net CONE (¥/kW) | Target Volume (GW) | FIT Expected (GW) | Long-term Decarbonization (GW) |
|---|
| FY2024 | 9,425 | 177.47 | 11.79 | — |
| FY2025 | 9,372 | 176.99 | 18.89 | — |
| FY2026 | 9,557 | 178.30 | 21.09 | — |
| FY2027 | 9,769 | 184.47 | 22.65 | 1.20 |
| FY2028 | 9,875 | 186.16 | 20.83 | 1.86 |
| FY2029 | 10,075 | 189.97 | 22.26 | 3.43 |
Notably, long-term decarbonization auction contract capacity has been progressively incorporated from FY2027, reaching 3.43 GW by FY2029, demonstrating tangible progress in Japan's power system decarbonization agenda.
V. The Growing Importance of Flexible Capacity
Cleared capacity with adjustment capability (dispatchable resources) totaled 119.37 GW in this auction, representing 60.7% of total procurement (196.77 GW including FIT expected capacity). LNG thermal contributed 57.98 GW and pumped hydro 22.33 GW. As renewable penetration continues to rise, the importance of fast-responding flexible capacity in maintaining grid stability is increasingly recognized, and the capacity market's incentive mechanism for flexible resources is attracting growing attention from policymakers and market participants alike.
Conclusion
The FY2029 capacity market main auction results highlight several critical features of Japan's evolving electricity market. First, market segmentation persists, with the ~22% price gap between eastern Japan (Hokkaido, Tohoku/Tokyo) and western Japan (Chubu/Hokuriku/Kansai/Chugoku/Shikoku) reflecting the structural constraint of limited inter-regional transmission capacity. Second, the total contracted value exceeding ¥2 trillion and the growing retail sector capacity charge burden are reshaping the cost structure of Japan's electricity retail market. Third, the rising share of long-term decarbonization auction contracts confirms that the capacity market is becoming a central policy instrument in Japan's energy transition, with implications extending well beyond simple supply adequacy assurance.