1. What Is the Capacity Market?
Japan's capacity market (容量メカニズム) is a cornerstone of the country's electricity system reform, launched formally in 2020 and operated by the Organization for Cross-regional Coordination of Transmission Operators (OCCTO). Its core purpose is to ensure that Japan's electricity system maintains sufficient generation capacity (kW) over the coming years to meet demand peaks and sustain supply reliability.
[Policy Background]
Following the full liberalization of electricity retail in 2016, intensified market competition led some generators to defer investment in new capacity due to revenue uncertainty. The capacity market was established to provide generators with a stable income stream — the capacity fee (容量拠出金) — incentivizing them to maintain or build new generation capacity and ensuring long-term system reliability.
2. Capacity Market vs. Energy Market: A Fundamental Distinction
| Dimension | Energy Market (JEPX Spot) | Capacity Market |
|---|
| Traded commodity | Energy (kWh) | Capacity (kW) |
| Trading timing | Day-ahead, per 30-minute slot | 4 years ahead, annual auction |
| Settlement basis | Actual generation volume | Committed capacity (kW) |
| Primary purpose | Short-term supply-demand balance | Long-term capacity adequacy |
| Operating body | JEPX | OCCTO |
In essence, the energy market answers "how much electricity is needed right now," while the capacity market answers "will there be enough power plants in the years ahead."
3. The Capacity Auction Mechanism
The capacity market uses a Main Auction held annually, procuring capacity for a delivery year four years in the future. For example, the auction conducted in 2024 procures capacity for fiscal year 2028 (April 2028 – March 2029).
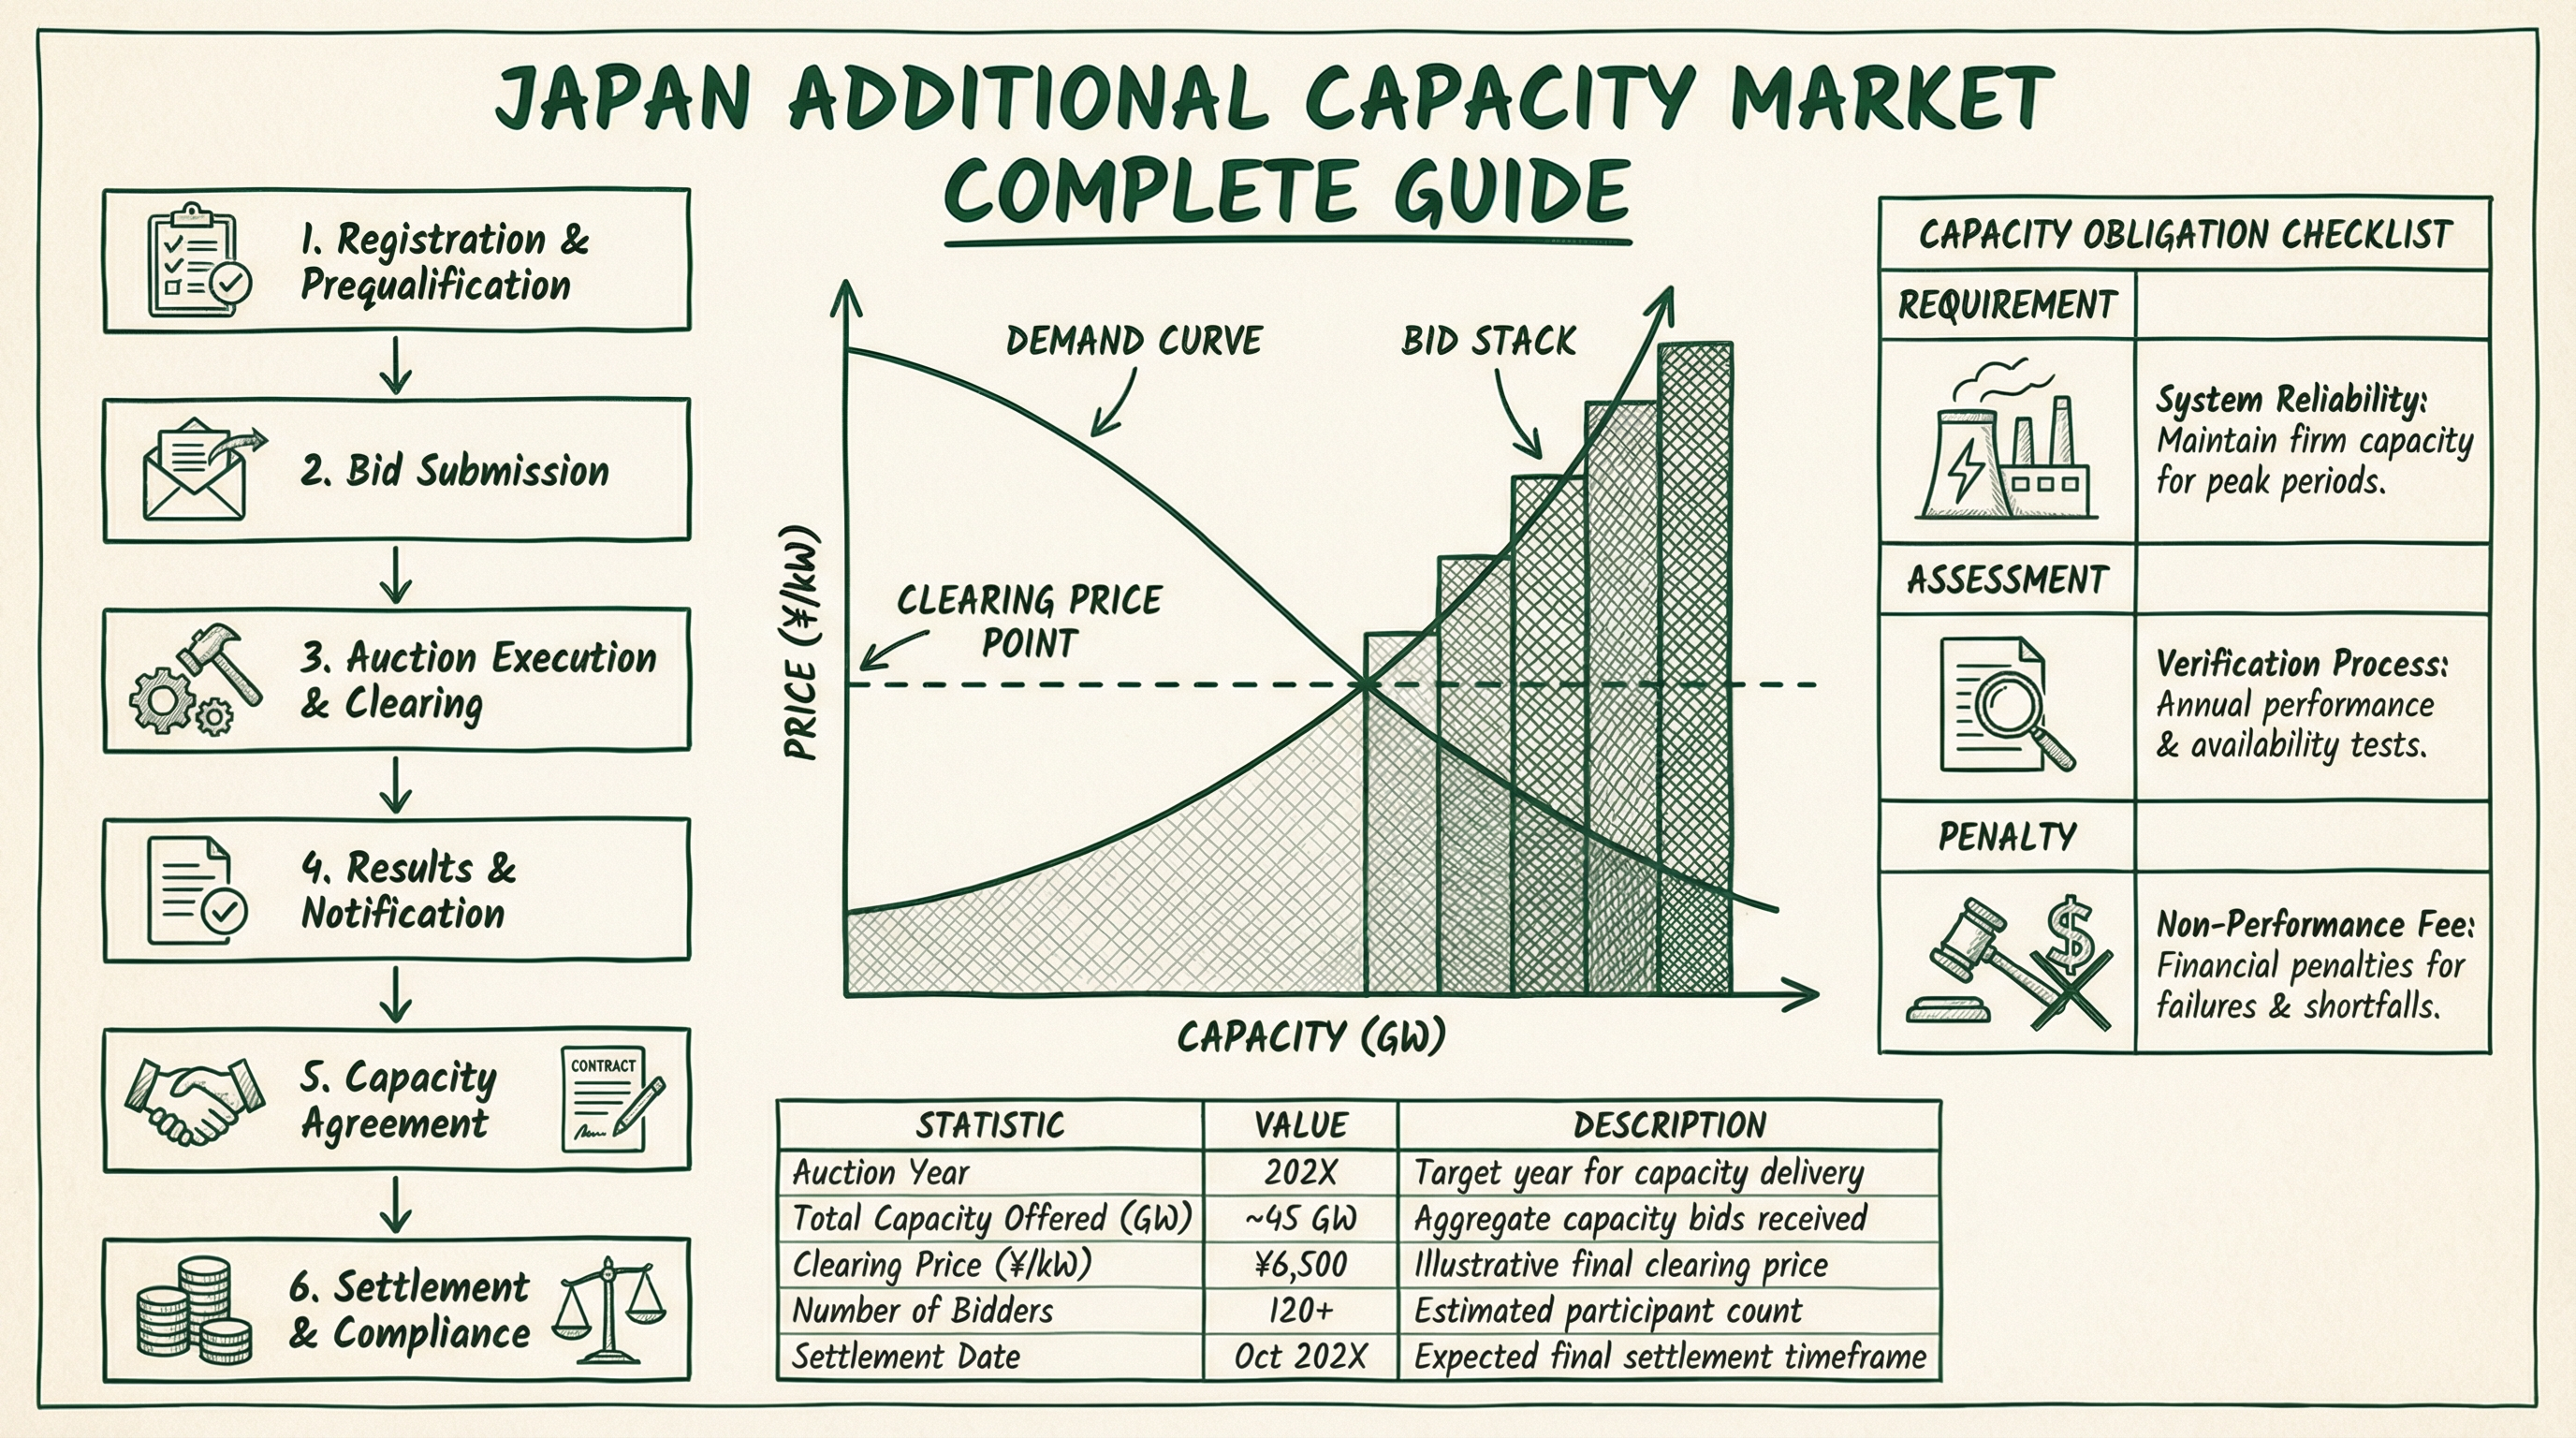
3.1 Auction Process
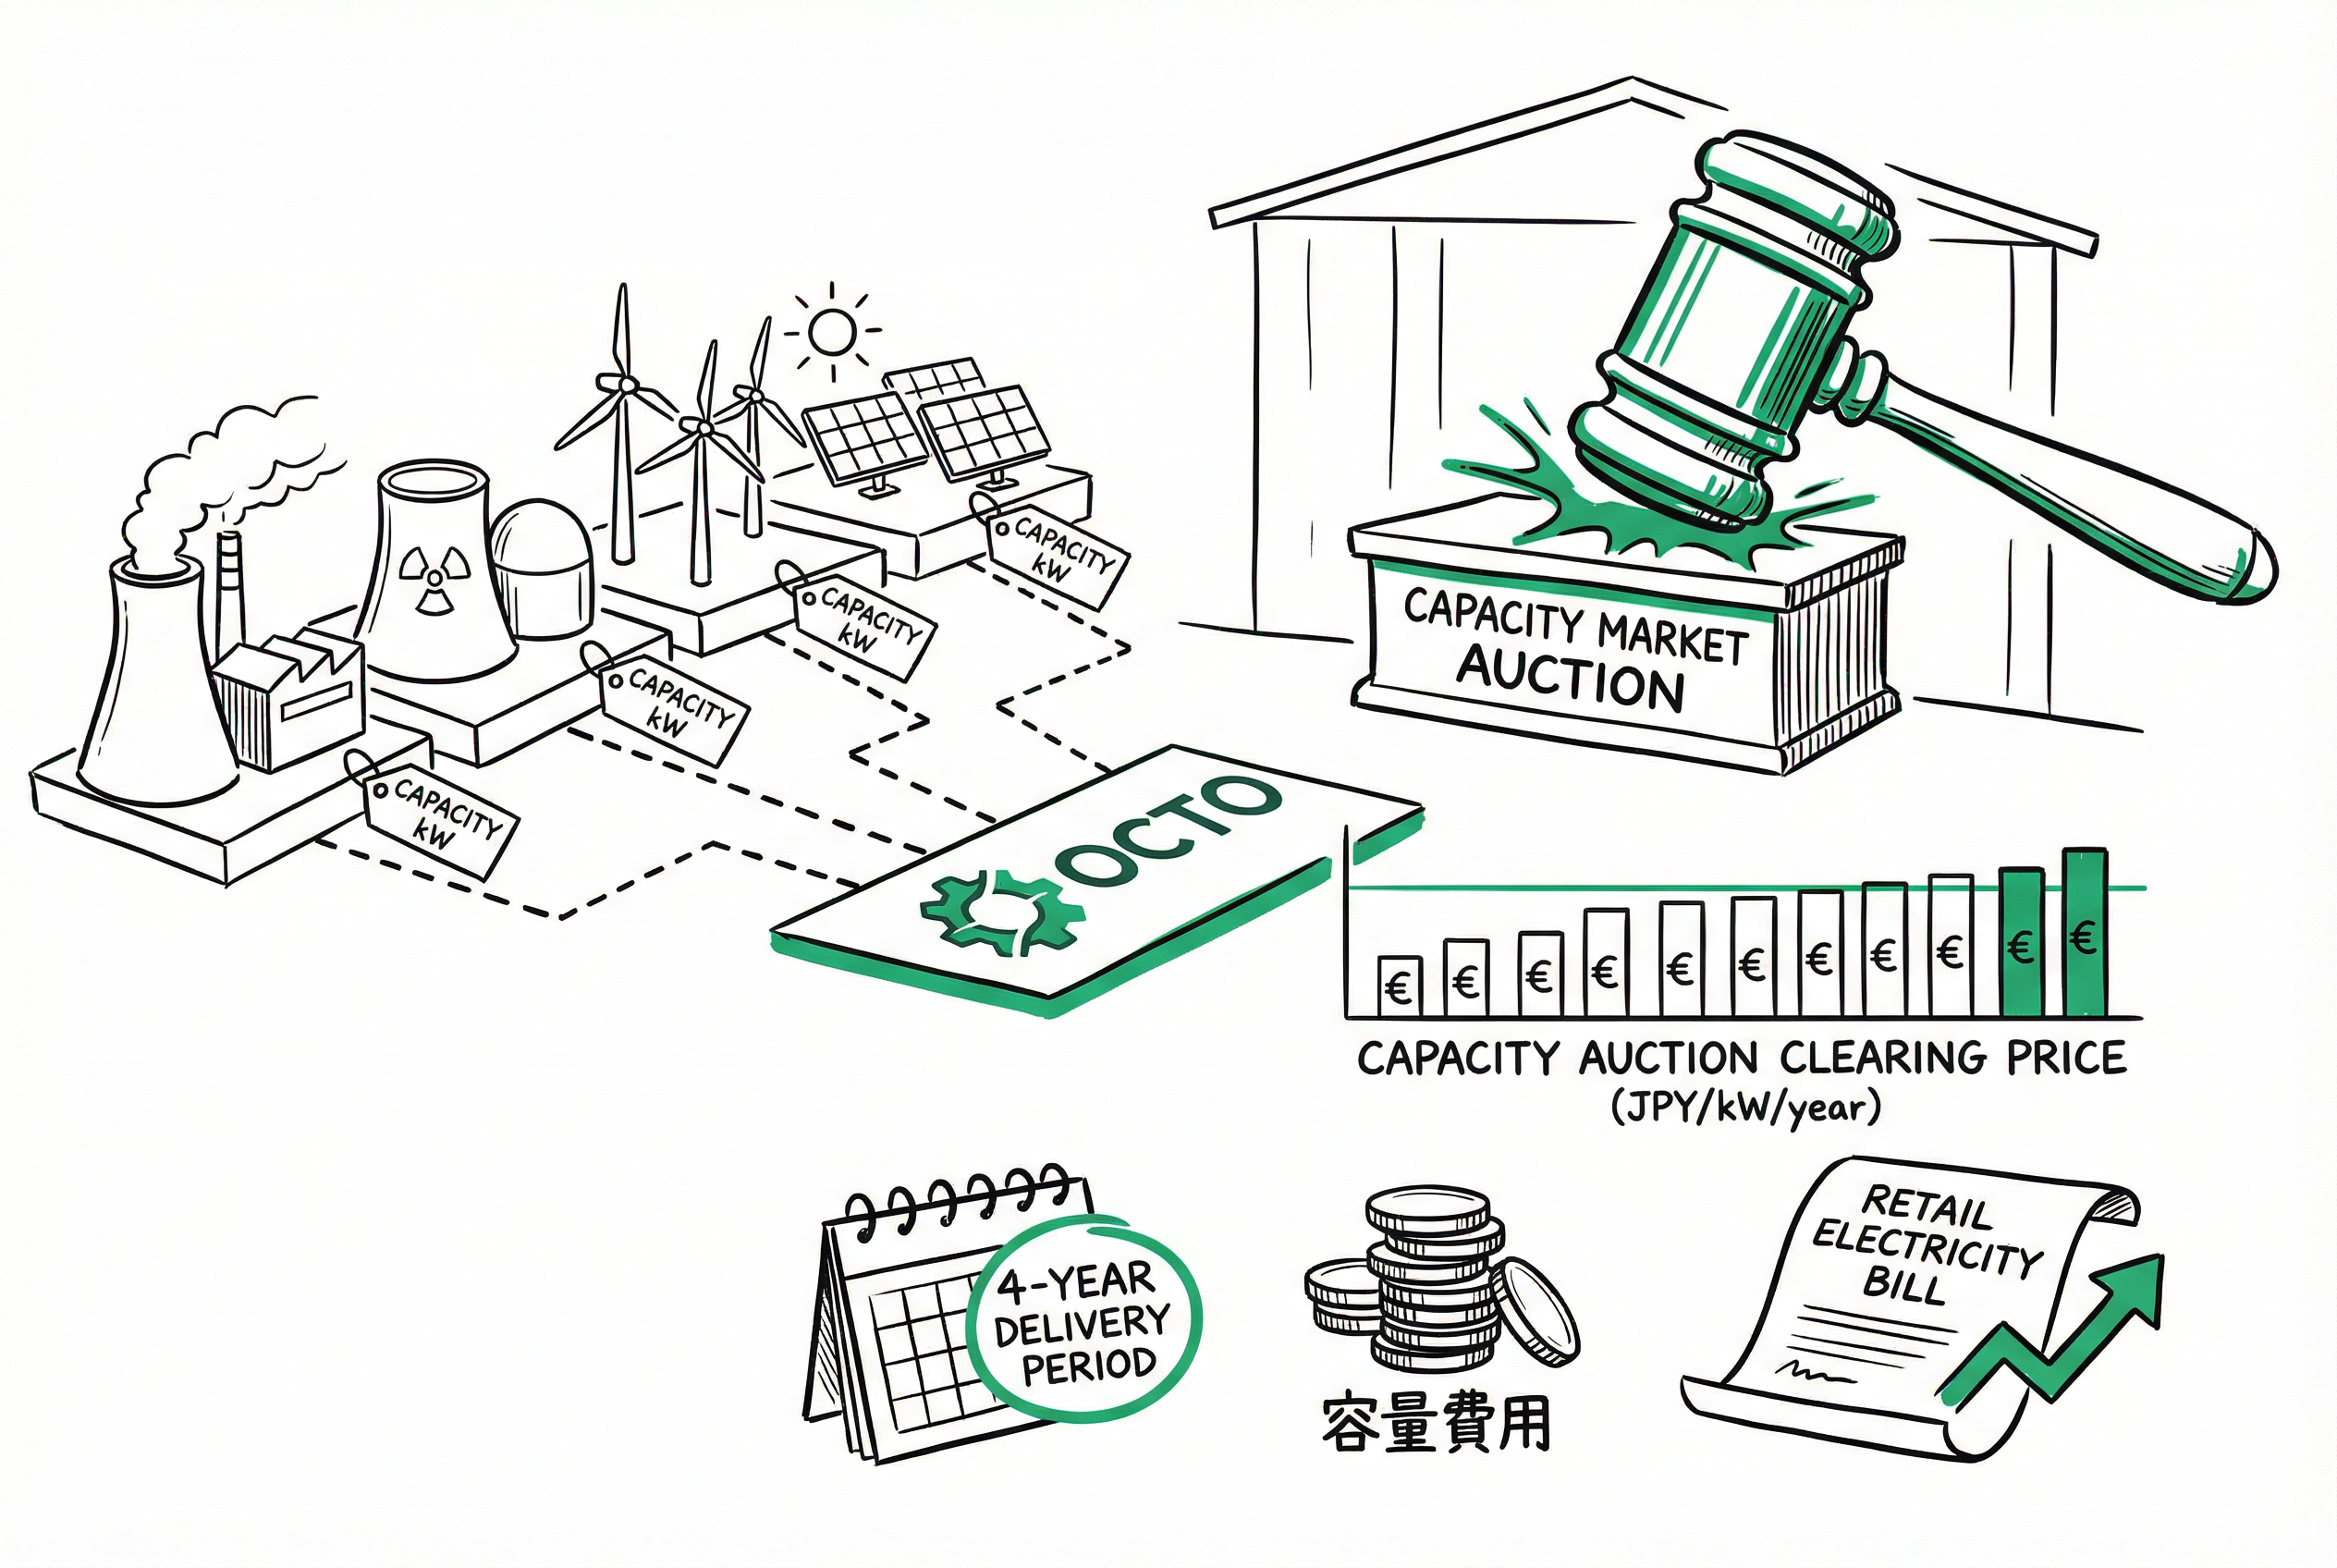
The auction employs a Uniform Clearing Price mechanism: all successful bidders receive the same clearing price (JPY/kW/year) regardless of their individual bid prices.
- Demand curve setting: OCCTO calculates the required total capacity based on reliability standards (target reserve margin) and sets a downward-sloping demand curve.
- Capacity provider bidding: Qualified providers submit bids specifying available capacity (kW) and minimum acceptable price (JPY/kW/year).
- Clearing calculation: OCCTO ranks all bids from lowest to highest price; the intersection with the demand curve determines the clearing price and procured volume.
- Capacity contract execution: Successful bidders sign 4-year capacity contracts with OCCTO, committing to deliver the specified capacity during the delivery year.
3.2 Historical Auction Results (Rounds 1–6)
Japan's capacity market has conducted six main auctions from 2020 to 2025. The pricing mechanism has evolved from a single national clearing price to a multi-area segmented pricing system.
| Round | Auction Year | Delivery Year | Procured Capacity (MW) | Clearing Price Summary (JPY/kW/year) |
|---|
| Round 1 | 2020 | FY2024 | 16,769 | 14,137 (national single price) |
| Round 2 | 2021 | FY2025 | 16,534 | 3,495 (national single price) |
| Round 3 | 2022 | FY2026 | 16,271 | Hokkaido 8,749 / Tohoku–Tokyo 5,833–5,834 / Chubu and west 5,832 / Kyushu 8,748 |
| Round 4 | 2023 | FY2027 | 16,745 | Hokkaido 13,287 / Tohoku 9,044 / Tokyo 9,555 / Chubu–Hokuriku 7,823 / Kansai–Chugoku–Shikoku 7,638 / Kyushu 11,457 |
| Round 5 | 2024 | FY2028 | 16,621 | Hokkaido 14,812 / Tohoku–Tokyo 10,280 / Chubu–Hokuriku–Kansai–Chugoku–Shikoku 8,785 / Kyushu 13,177 |
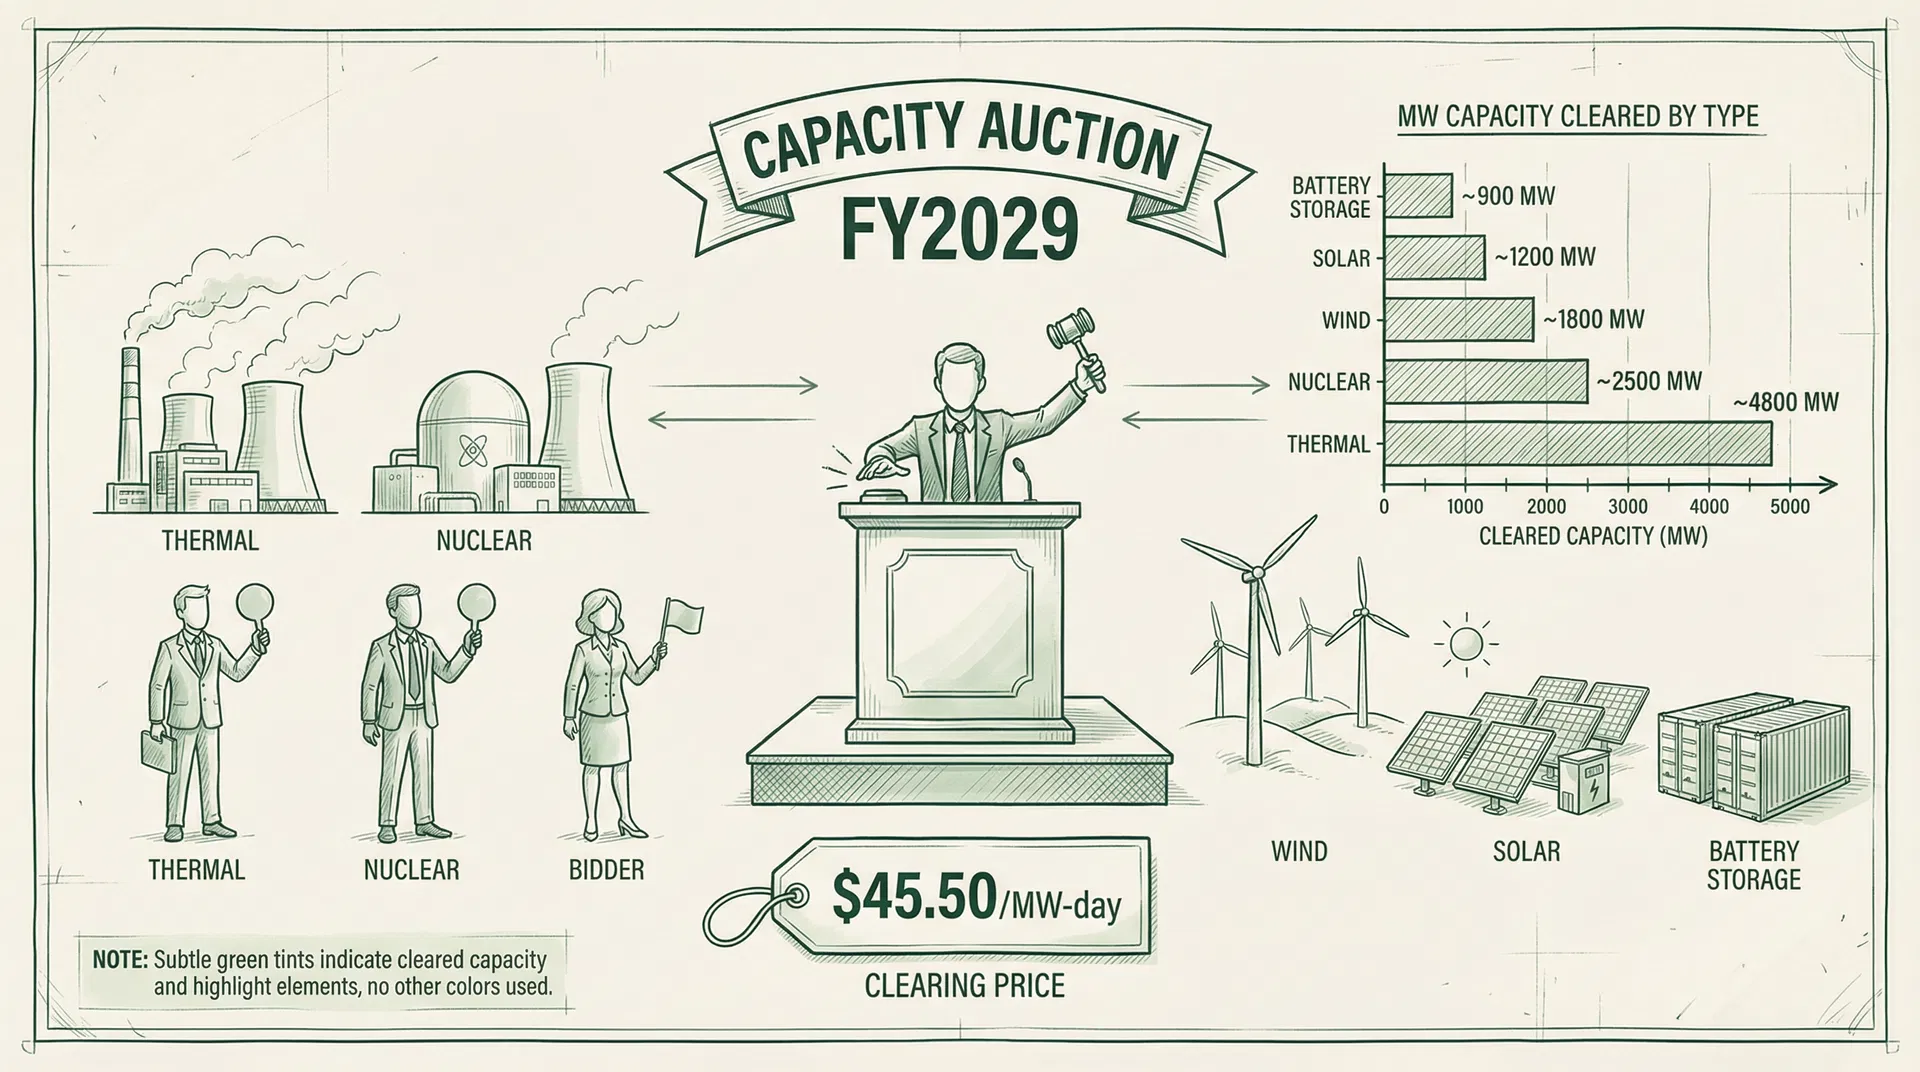
| Round 6 | 2025 | FY2029 | 16,608 | Hokkaido 14,972 / Tohoku–Tokyo 15,111 / Chubu–Hokuriku–Kansai–Chugoku–Shikoku 12,388 / Kyushu 15,112 |
[Round 6 (FY2029) Highlights]
The Round 6 results announced in January 2025 set multiple records: total contracted value of approximately ¥2.2094 trillion (+19% year-on-year), and a post-transitional-measure national average unit price of approximately ¥13,303/kW — both all-time highs. For the first time, all areas cleared above the benchmark price (Net CONE: ¥10,075/kW), with Tohoku, Tokyo, and Kyushu reaching the price cap (1.5× benchmark: ¥15,113/kW). This signals nationwide capacity tightness. FY2029 is also the final year of the transitional deduction measure (deduction rate 1.5%+3.6%=5.1%); from FY2030, the full capacity contribution will be levied.
4. Capacity Provider Qualification Requirements
| Resource Type | Capacity Calculation Method | Notes |
|---|
| Thermal (gas, coal, oil) | Nameplate capacity × availability factor | Primary resource, highest share |
| Nuclear | Nameplate capacity × availability factor | Requires restart approval |
| Hydro (incl. pumped storage) | Seasonally adjusted capacity | Higher summer capacity; pumped storage requires ≥3 hours generation capability |
| Solar PV | Nameplate × low contribution factor (3–8%) | Low rating due to output variability |
| Wind | Nameplate × low contribution factor (5–10%) | Same rationale as solar |
| Battery storage (BESS) | Discharge power (kW) × evaluation factor | Eligible as Stable Resource from FY2027 auctions (requires ≥3 hours discharge duration) |
| Demand Response (DR) | Curtailable load (kW) × adjustment factor | Participates as Dispatch-Command Resource; minimum 1,000 kW required |
| Interconnection capacity | Available transmission capacity (kW) | Managed centrally by OCCTO |
4a. BESS Participation Requirements in Detail
4a.1 Resource Classification and Minimum Discharge Duration
BESS classification in the capacity market depends on scale and discharge duration:
| Condition | Resource Classification | Applicable Period |
|---|
| Expected capacity ≥1,000 kW AND discharge duration ≥3 hours | Stable Resource (highest evaluation) | Applicable from FY2027 auctions onward |
| Expected capacity ≥1,000 kW BUT discharge duration <3 hours | Dispatch-Command Resource | All periods |
| Expected capacity <1,000 kW (standalone) | Dispatch-Command Resource (aggregation required) | All periods |
[Significance of BESS Stable Resource Registration]
BESS registered as a Stable Resource receives the same high evaluation factor as thermal generation, yielding a higher capacity assurance contract value. However, obligations are also more demanding: during low-reserve evaluation slots (approximately 30 hours/year), the BESS must respond to supply instructions from the general transmission and distribution operator (TSO) and provide remaining available capacity after gate closure.
4a.2 BESS Performance Obligations (Stable Resource Registration)
| Obligation | Content | Penalty for Non-Compliance |
|---|
| Planned outage coordination | Comply with OCCTO capacity outage plan adjustment requests | Non-adjustment days × 0.3% (standard) or 0.6% (supply reliability impact) × contract value |
| Market bidding | Bid remaining capacity into wholesale electricity markets | Reduction based on violation severity |
| Supply instruction response | Receive TSO supply instructions; provide remaining capacity after gate closure | Shortfall × contract value / annual low-reserve hours (~30 hours) |
| Capability verification test | Annual effectiveness test confirming supply capacity ≥ contracted capacity | Capacity below contracted level after test triggers market exit for that portion |
| No decommissioning or output reduction | Cannot decommission or reduce output beyond necessary levels during delivery year | Reduction based on violation severity |
4b. DR (Demand Response) Participation Requirements in Detail
4b.1 DR Resource Classification
DR resources participate in the capacity market as "Dispatch-Command Resources" — an aggregated resource type that allows aggregators to bundle multiple small-scale DR assets for market participation.
| Requirement | Content |
|---|
| Minimum scale | Expected capacity ≥1,000 kW per metering unit (achievable through aggregator bundling) |
| Participant eligibility | Generation business operators, DR aggregators, or delegation to retail electricity suppliers |
| Metering equipment | Installation of verifiable metering devices (smart meters, etc.) to confirm demand reduction volumes |
| Simple command system | OCCTO online command system must be built by end of February, three years before the delivery year |
| Expected capacity calculation | Calculated by multiplying historical demand reduction performance by an adjustment factor |
4b.2 DR Performance Obligations (Dispatch-Command Resource)
[Core Obligation: Responding to Dispatch Commands]
The core obligation for DR is to receive dispatch commands from the TSO and provide demand reduction capacity equal to or exceeding the contracted capacity, within the limits of up to 12 times per year, 3 consecutive hours per dispatch. Maximum one dispatch per day.
| Obligation | Content | Penalty for Non-Compliance |
|---|
| Dispatch command response | Receive dispatch commands; provide supply capacity ≥ contracted capacity for up to 12 dispatches/year × 3 consecutive hours each | Shortfall × contract unit price × 110% × (shortfall / contracted capacity × 12 dispatches × 3 hours) |
| Effectiveness test | Annual (summer and winter) OCCTO effectiveness tests confirming supply capacity ≥ contracted capacity | Capacity below contracted level after test triggers market exit for that portion |
| Supply provision method | Demand reduction achieved through bilateral contracts with retail suppliers or bidding into wholesale electricity markets | — |
Note: The TSO may issue more than 12 dispatch commands per year (excess dispatches are not counted in penalty calculations), but DR operators should thoroughly assess their resource response reliability before entering into capacity assurance contracts.
5. Capacity Fee Calculation and Cost Pass-Through
5.1 Total Capacity Fee Calculation
Total capacity fee for delivery year = Clearing price (JPY/kW/year) × Procured capacity (kW)
FY2024 example: ¥14,137/kW/year × 167,690,000 kW ≈ ¥2.43 trillion
5.2 Allocation to Retailers
Retail electricity suppliers bear capacity contributions in proportion to their annual peak kW share, while general TSOs bear contributions based on each area's H3 demand forecast:
Each supplier's capacity contribution ≈ Total national capacity fee × (Supplier's annual peak kW share ÷ National total share)
5.3 Capacity Contribution Levy Trend (FY2024–FY2029)
The following shows the national average unit price trend of capacity contributions actually borne by retail electricity suppliers (based on H3 demand forecast values):
| Delivery Year | National Average Unit Price (JPY/kW/year) | Corresponding Auction Clearing Price | Notes |
|---|
| FY2024 | 775 | 14,137 (Round 1) | First year of the system; high transitional deduction rate |
| FY2025 | 248 | 3,495 (Round 2) | Clearing price plunged; levy at historic low |
| FY2026 | 409 | 5,832 (Round 3 avg.) | First market segmentation; price recovery |
| FY2027 | 622 | ~9,500 (Round 4 avg.) | Continued increase; capacity tightness signal |
| FY2028 | 879 | ~10,000 (Round 5 avg.) | High-price segmentation in Hokkaido and Kyushu |
| FY2029 | ~1,200+ (estimated) | 13,303 (Round 6 avg.) | Record-high clearing price; final year of transitional deduction (5.1%) |
[Why FY2029 Levy Will Rise Sharply]
The FY2029 capacity contribution is expected to increase substantially for three reasons. First, the Round 6 clearing price (national average ¥13,303/kW) set an all-time record. Second, FY2029 is the final year of the transitional deduction (only 5.1% deduction remaining); from FY2030, the full amount will be levied, causing a further step-up in burden. Third, three areas (Tohoku, Tokyo, Kyushu) reached the price cap (¥15,111–15,112/kW), signaling nationwide capacity tightness.
5.4 Reflection in End-User Bills
Retail suppliers incorporate capacity contributions as a cost component in end-user electricity tariffs, typically labeled as "capacity fee" or "system maintenance fee," charged based on the customer's contracted demand (kW) or consumption (kWh).
[End-User Impact Estimate]
For a typical household consuming 500 kWh/month, the FY2024 capacity fee burden is approximately ¥400–600/month, representing roughly 5–8% of the total electricity bill. As clearing prices continue to rise, this burden is expected to increase significantly from FY2029 onward. Retailers differ in how they pass through this cost: some itemize it separately as "capacity contribution equivalent" and adjust annually, while others include it in the basic charge or energy charge.
6. Strategic Implications for Retail Electricity Suppliers
6.1 Capacity Contributions Are a Fixed Cost
Unlike JEPX spot prices, capacity contributions are a fixed cost tied to supply volume that cannot be avoided through market operations. For PPS, accurately forecasting future supply volume is the key to managing capacity contribution costs.
6.2 Dual Participation Opportunity
PPS with their own generation assets can simultaneously participate as capacity providers, using capacity fee income to offset their capacity contribution payments — or even generate net revenue. This "dual participation" strategy is a significant competitive advantage for large integrated electricity suppliers.
6.3 DR Resources as Capacity Market Assets
VPP aggregators and industrial DR resources can participate in the capacity market as "demand response capacity." For pure retailers without generation assets, developing DR resources and entering the capacity market is an important pathway to reducing net capacity contribution costs.
7. Controversies and Reform Directions
7.1 The Low Contribution Factor Problem for Renewables
Solar and wind capacity contribution factors of only 3–10% are far below their nameplate capacity. Critics argue this design undervalues renewable contributions and hinders the energy transition. Proponents counter that without large-scale storage, variable renewables cannot reliably provide "firm capacity" during peak demand periods.
7.2 The "Life Extension" Effect for Aging Thermal Plants
Capacity fees provide financial incentives for aging thermal plants to remain operational, which some environmental groups criticize as an obstacle to carbon neutrality. METI is studying a differentiated mechanism that would prioritize "decarbonized capacity."
7.3 2026 Reform Priorities
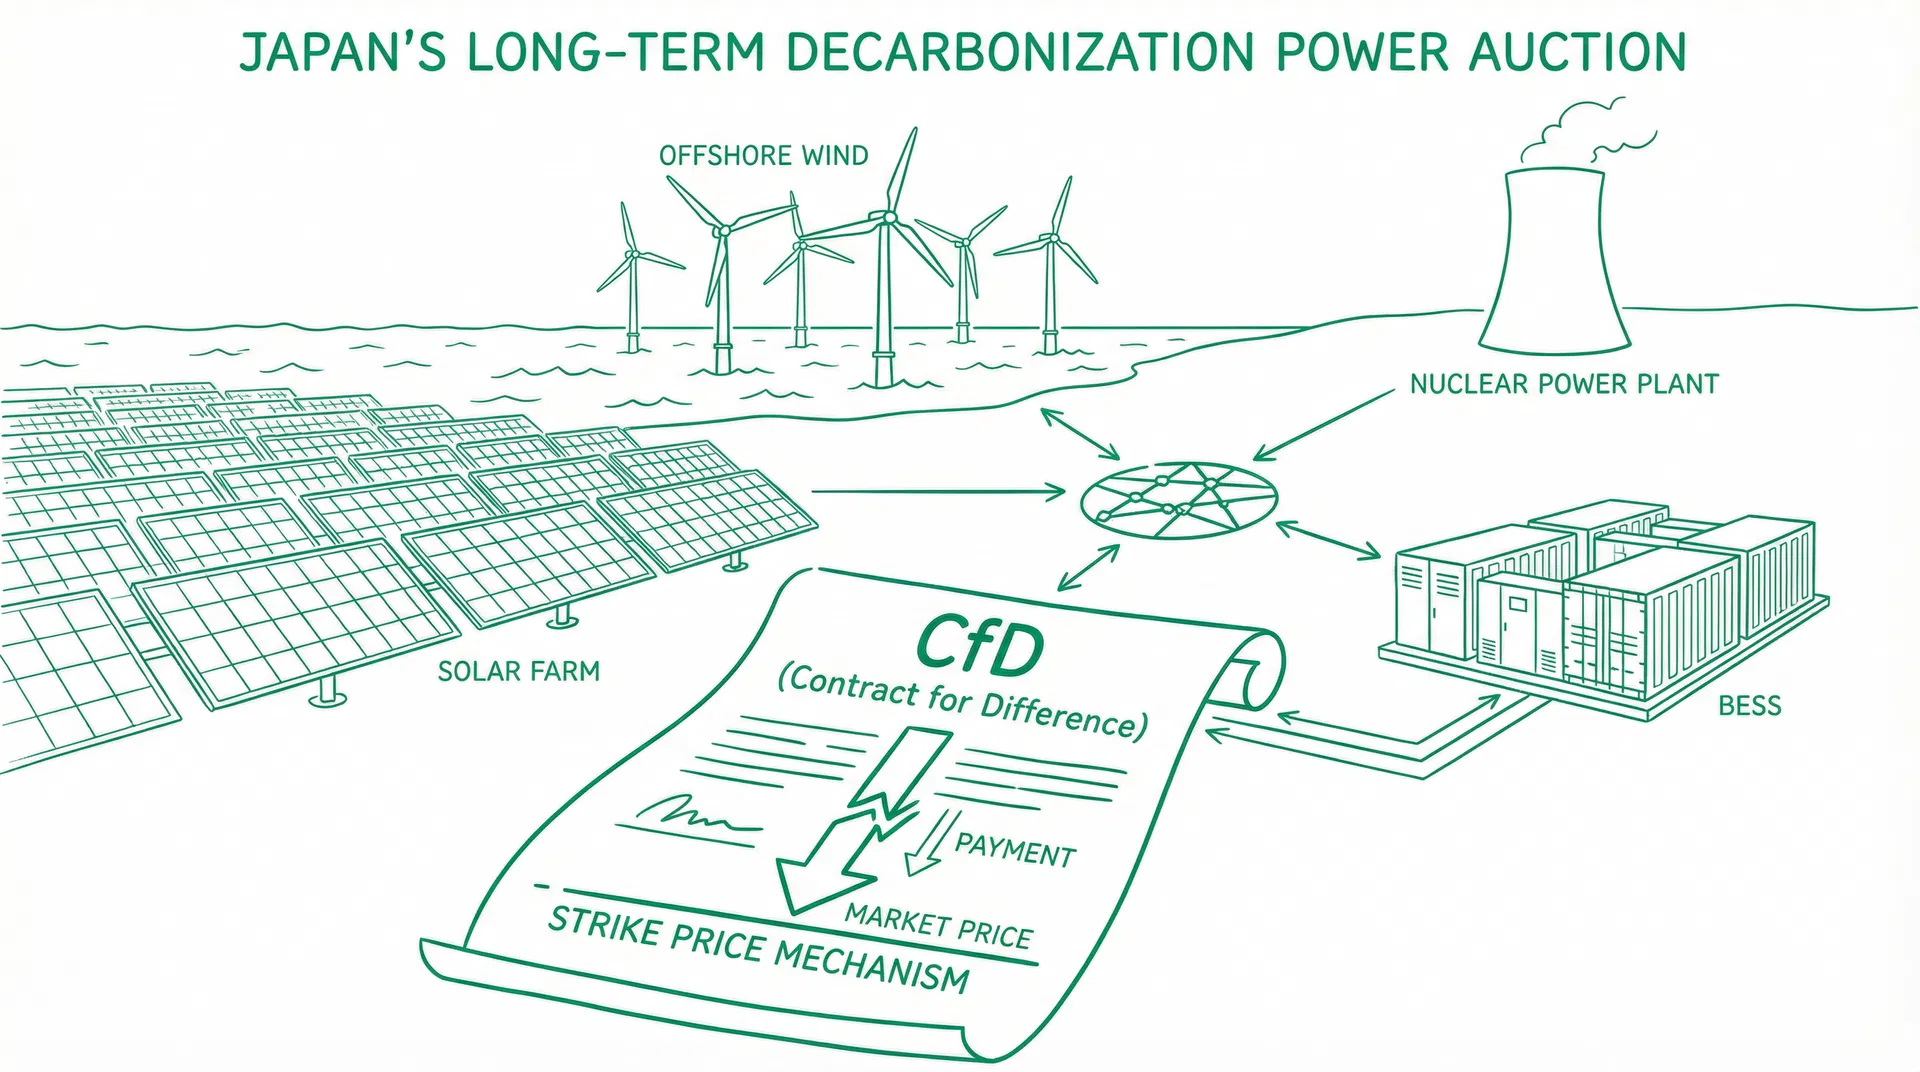
Based on Japan's 7th Strategic Energy Plan, capacity market reforms include: enhanced capacity recognition for hydrogen and ammonia fuel plants; higher capacity contribution factors for battery storage systems; and research into introducing long-term Contracts for Difference (CfD) to provide more stable investment returns for new low-carbon generation.
"The capacity market is Japan's last line of defense for power system reliability. Understanding its mechanics is a prerequisite for evaluating the long-term investment value of Japan's electricity market."