Japan's Capacity Contribution Charge, Refund Deduction, and Consumer Impact: A Complete Guide
Introduction
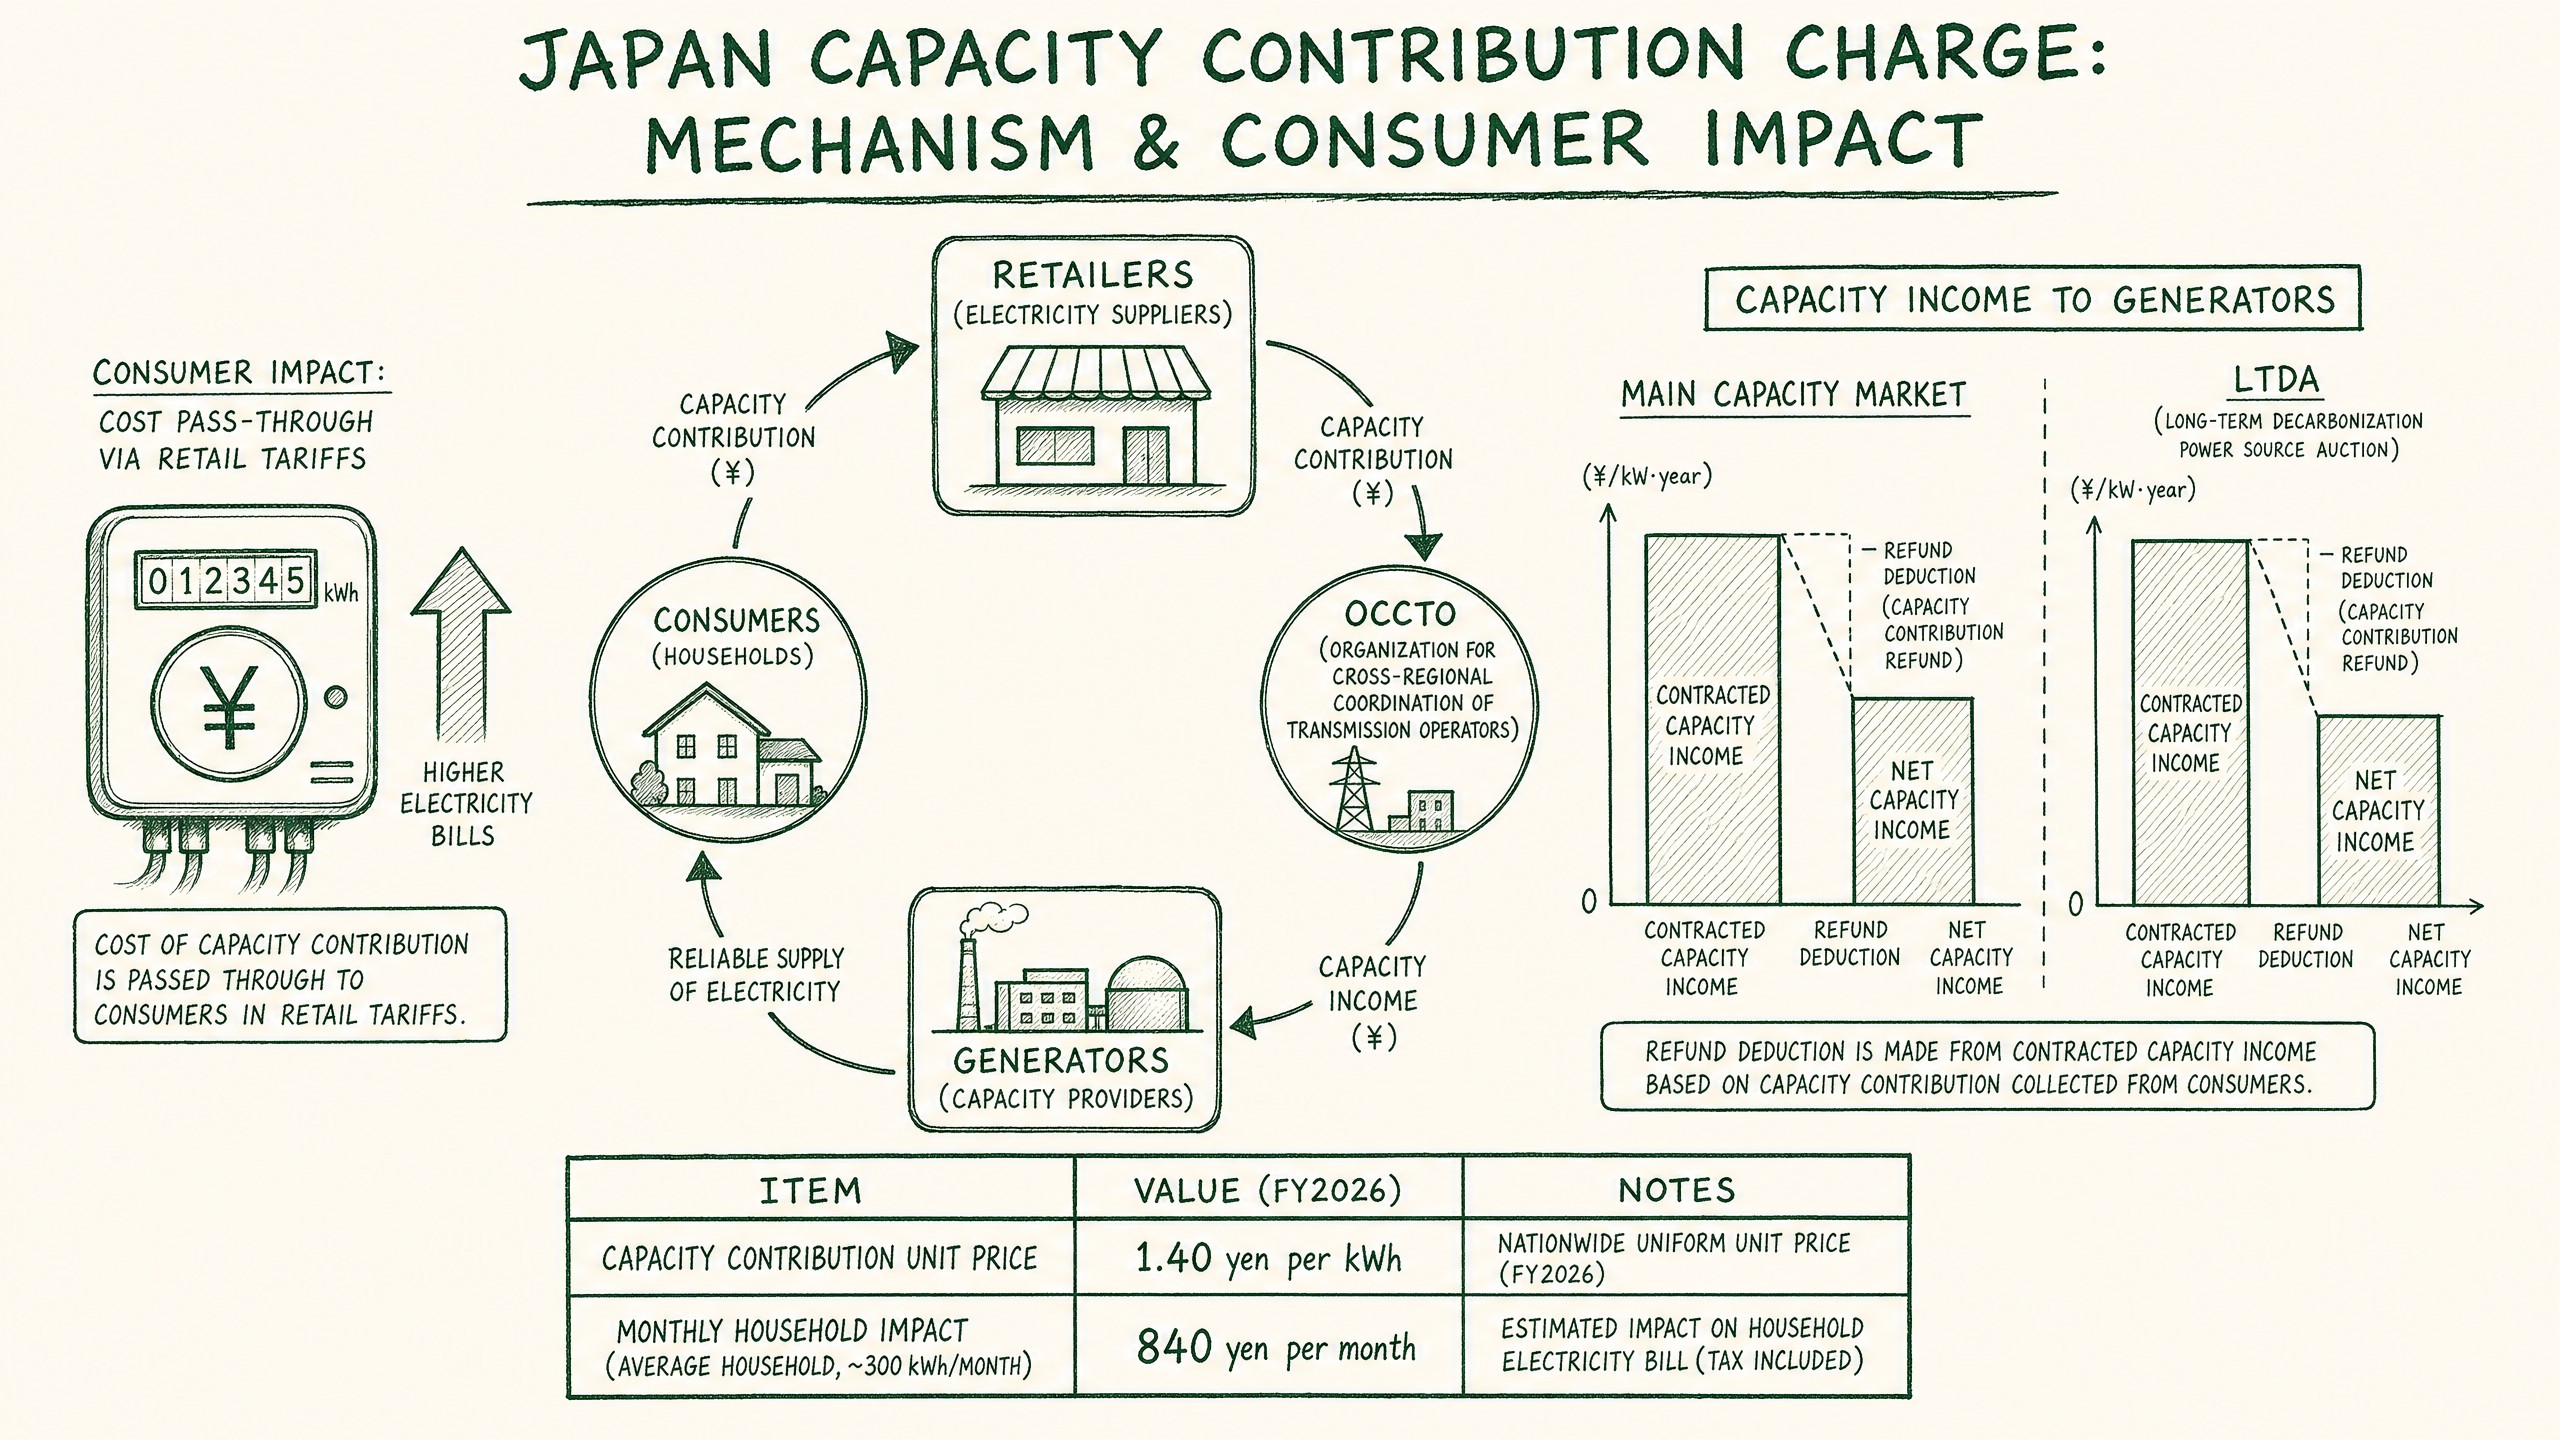
Since Japan's capacity market entered its actual supply-demand phase in FY2024, the "capacity contribution charge" (容量拠出金, kyoshutsukin) has become an unavoidable cost item for electricity retailers and large consumers. The contracted total for FY2029 reached a record ¥2.2094 trillion, and questions about the "refund deduction" (還付控除, kanpu kojo) mechanism in the Long-Term Decarbonization Auction (LTDA), as well as how these costs are ultimately passed on to end consumers, have generated widespread discussion. This article systematically explains the calculation logic of the capacity contribution charge, the fundamental differences between the main auction and LTDA refund deduction mechanisms, retailer cost allocation, and the practical impact on electricity consumers.
I. Basic Structure of the Capacity Contribution Charge
The capacity contribution charge is the financial core of the capacity market. Power generators receive a "capacity assurance contract amount" (supply capacity maintenance fee) through capacity market auctions, and the funding source is the capacity contribution charge paid jointly by electricity retailers, general transmission and distribution operators, and distribution operators.
Calculation Formula
| Level |
Formula |
| National total |
Contracted capacity × contracted unit price |
| Area-level total |
National total × area H3 demand ratio |
| Retailer burden total |
Area total − transmission operator burden − transitional deduction |
| Individual retailer charge |
Retailer burden total × retailer's peak-hour kW share |
What is the Transitional Deduction (経過措置控除額)? To cushion the impact on existing generators during the early phase of the capacity market, OCCTO deducts a fixed amount from the area-level capacity contribution total for generators with long-term supply contracts or policy support. The deduction amount and period are phased down annually until the full cost is eventually passed on to retailers. As a result, retailers' actual burden in the early years is lower than the theoretical full-cost figure.
What is the Peak-Hour kW Share (ピーク時kWシェア)? Each retailer's share of the area's total supply obligation (kW) during the H3 hour (3rd highest annual demand hour). The reference period is January 1 to December 31 of the prior fiscal year, calculated by OCCTO based on demand forecast reports submitted by each retailer. Retailers with a higher share receive proportionally larger monthly capacity contribution charge invoices.
What is the H3 Demand Ratio? The H3 demand ratio is each electricity area's share of national total demand during the "3rd highest annual demand hour" (H3 hour). OCCTO calculates and publishes this ratio annually. Major consumption areas such as Tokyo and Kansai tend to have higher ratios; Hokkaido and Shikoku tend to be lower. Areas with higher H3 demand ratios carry a proportionally larger absolute share of the national capacity contribution charge. → Glossary: H3 Demand Ratio
What is the H1 Demand Ratio? The H1 demand ratio is each electricity area's share of national total demand during the "1st highest annual demand hour" (H1 hour) — the single peak demand moment of the year. Like the H3 ratio, OCCTO calculates and publishes this annually. H1 values tend to be slightly higher than H3 values since they reference the absolute peak. The H1 ratio is referenced in certain capacity contribution charge calculations. → Glossary: H1 Demand Ratio
Main Auction Contracted Results Trend
| Delivery FY |
Bidding FY |
Contracted Capacity |
Unit Price (¥/kW) |
Total Contract Value |
| FY2024 |
FY2020 |
~167,690 MW |
Nationwide: 14,137 |
~¥1.5987 trillion |
| FY2025 |
FY2021 |
~165,340 MW |
Hokkaido/Kyushu: 5,242 / Others: 3,495 |
~¥514 billion |
| FY2026 |
FY2022 |
~162,710 MW |
Hokkaido: 8,749 / Kyushu: 8,748 / Tokyo: 5,834 / Others: 5,832 |
~¥842.5 billion |
| FY2027 |
FY2023 |
~167,450 MW |
Hokkaido: 13,287 / Kyushu: 11,457 / Tokyo: 9,555 / Others: 7,638 |
~¥1.314 trillion |
| FY2028 |
FY2024 |
~166,210 MW |
Hokkaido/Tohoku/Tokyo: 14,812 / Kyushu: 13,177 / Others: 8,785 |
~¥1.8506 trillion |
| FY2029 |
FY2025 |
~166,080 MW |
Kyushu: 15,112 / Tohoku/Tokyo: 15,111 / Hokkaido: 14,972 / Others: 12,388 |
~¥2.2094 trillion |
The contracted total has grown more than fourfold from ¥514 billion (FY2025 delivery) to ¥2.2094 trillion (FY2029 delivery), driven by demand curve design changes, increased ancillary service demand from renewable energy expansion, and widening supply-demand tightness differences between areas.
II. Refund Deduction: The Fundamental Difference Between Main Auction and LTDA
The "refund deduction" is a mechanism unique to LTDA and fundamentally different from the main auction's operating logic.
Main Auction: No Refund Obligation
Main auction winning power sources receive a fixed remuneration (kW × contracted price × contract period) as their capacity assurance contract amount. They have no obligation to refund revenues from other markets (spot market, ancillary services market, etc.) to OCCTO. Main auction winners can simultaneously retain both capacity income and other market revenues.
LTDA: 90% Refund Obligation
LTDA winning power sources can receive fixed capacity income for up to 20 years, but this is designed as "fixed cost assurance" — approximately 90% of revenues earned in other markets (spot, ancillary services, FIT, etc.) must be refunded to OCCTO.
The refund mechanism operates in three tiers:
| Tier |
Revenue Range |
Refund Rate |
Generator Retention |
| Tier 1 |
Up to business return amount |
95% |
5% |
| Tier 2 |
Above business return ~ difference between LTDA unit price and main auction price |
90% |
10% |
| Tier 3 |
Exceeding the above difference |
85% |
15% |
What is the "Business Return Amount" (事業報酬額)?
The business return amount is the minimum revenue level that an LTDA-winning generator is entitled to retain as "fixed cost assurance." It is calculated by OCCTO based on each generator's construction costs, maintenance costs, and capital cost, and differs per facility. Tier 1 (95% refund) applies up to this threshold — the generator retains 5% of revenues within this range, with 95% refunded to OCCTO.
How the 90% Refund Obligation Works
When a generator's revenues from other markets (spot, ancillary services, FIT, etc.) exceed the business return amount, 90% of the excess must be refunded to OCCTO. This 90% rate applies only up to the "difference between the LTDA contracted unit price and the main auction contracted price" (the Tier 2 ceiling). Beyond that ceiling (Tier 3), the refund rate eases to 85%. This tiered design ensures generators retain 5% of revenues up to the business return amount (with 95% refunded), while the majority of excess profits are returned to society — ultimately reducing the capacity contribution charge burden on consumers. → Glossary: Business Return Amount
The core design principle is that LTDA provides "fixed cost assurance," not "excess profit assurance." Revenues earned in other markets should largely be returned to society (reducing consumer burden) rather than retained exclusively by the generator.
Net Contracted Total After Refund Deduction (LTDA Round 3, FY2025 Bidding)
| Source Type |
Nominal Contract Total |
Net After Refund Deduction (3-year avg.) (see glossary) |
Compression Ratio |
| Decarbonization sources |
¥346.4B/year |
¥94.5B/year |
~27% |
| LNG thermal |
¥101.7B/year |
¥34.0B/year |
~33% |
| Total |
¥448.1B/year |
¥128.5B/year |
~29% |
III. Retailer Allocation Mechanism
Allocation by Peak-Hour kW Share
Retailers' capacity contribution charge burden is allocated based on each area's peak-hour (H3 period) kW supply share. Retailers with larger peak-hour supply volumes face proportionally higher charges.
Impact of Area-Specific Price Differences
| Area |
FY2029 Unit Price (¥/kW) |
Premium vs. Lowest |
| Kyushu |
15,112 |
+22% |
| Tohoku / Tokyo |
15,111 |
+22% |
| Hokkaido |
14,972 |
+21% |
| Chubu / Kansai / Chugoku / Shikoku / Okinawa |
12,388 |
Baseline |
Cost Pass-Through Methods to Consumers
| Method |
Description |
Consumer Risk |
| Fixed fee |
Monthly fixed amount; retailer absorbs market fluctuation risk |
Low (budget predictable) |
| Variable fee |
Pass-through of actual OCCTO invoice amount |
High (tracks market movements) |
| Hybrid |
Partial inclusion in base rate + separate variable adjustment fee |
Medium |
IV. Impact on End Consumers
Scale of Electricity Bill Increases
Industry estimates suggest the FY2029 capacity contribution charge will add approximately ¥500–1,000/month for an average household (400 kWh/month) and ¥100,000–200,000/month for a mid-sized factory (100,000 kWh/month).
Widening Regional Disparities
With area-specific pricing, consumers in high-price areas like Kyushu, Tohoku, and Tokyo face approximately 22% higher capacity contribution charges than those in Chubu or Shikoku — adding complexity for companies with multi-regional operations.
Consumer Strategies
Peak Demand Management (DR): Since allocation is based on peak-hour kW share, reducing consumption during annual peak periods (typically specific summer or winter hours) can lower the retailer's allocation ratio and indirectly reduce consumer costs in subsequent years.
Contract Type Selection: Fixed-fee contracts offer budget certainty; variable-fee contracts are cost-advantageous in low-charge years (e.g., FY2025: ¥514 billion) but carry higher risk in peak years (e.g., FY2029: ¥2.2 trillion). Companies should choose based on their risk tolerance.
Self-Consumption and Renewable Energy: Self-consumed electricity is excluded from the allocation basis, so investment in rooftop solar and battery storage effectively reduces the practical capacity contribution charge burden.
V. LTDA Refund Recycling Effect
LTDA refund payments are not retained by OCCTO but are distributed back to retailers as "rebates," reducing their capacity contribution charge burden. For LTDA Round 3, the difference between the nominal contracted total (¥448.1B/year) and the net after refund deduction (¥128.5B/year) — approximately ¥319.6B/year — is expected to flow back to retailers, indirectly benefiting consumers through lower electricity bills.
VI. Conclusion
The capacity contribution charge system is an important financial pillar of Japan's electricity market reform, but its complex calculation logic, regional disparities, and LTDA's multi-tier refund deduction design make it difficult for consumers to intuitively grasp their actual burden. With FY2029's contracted total reaching a record high, electricity cost management has become a critical business issue. Understanding the system's financial logic is a prerequisite for developing effective response strategies.